April 26, 2021
By Andrew Hecht
- A late February peak runs out of steam and makes a comeback
- LME and COMEX stocks rise
- Inventories can be a mirage
- Goldman Sachs makes a bullish call- Three reasons for higher copper prices
- Heading for new high- Copper could go parabolic
In March 2020, nearby COMEX copper futures traded to the lowest price since June 2016, when it reached a bottom at $2.0595 per pound. In February 2021, the price traded at a decade high at $4.3630 on the continuous contract. Copper fell during the height of the global pandemic’s impact on markets across all asset classes. The price moved from a four-year low to a ten-year high in a little less than one year.
The trend in copper is higher, and we could be on the verge of a move to prices above the 2011 $4.6495 peak. Copper is a building block of infrastructure worldwide, but it is also a metal with many industrial applications.
A late February peak runs out of steam and makes a comeback
The trend of higher lows and higher highs in the copper futures market remained intact at the end of last week.
.png?width=746&name=Copper%20(1).png)
Source: TradingView
After reached a continuous contract peak at $4.3630 in late February, the highest price in a decade, copper pulled back below the $4 level, reaching $3.8760 in early March. Since then, the price has been climbing and was back above the $4.33 level at the end of last week. Open interest, the total number of open long and short positions in the COMEX copper market moved from a low of under 162,000 contracts in May 2020 when copper’s price was under $2.40 per pound to the 247,572 level at the end of last week with May copper futures settling at $4.3360. Rising price and increasing open interest is a technical validation of a bullish trend in a futures market. Weekly price momentum and relative strength indicators were well above neutral readings and rising. Weekly historical volatility at 18.76% indicates the bullish trend is slow and steady. The metric reached a high of over 37% in May 2020.
Copper backed off from the February decade-high peak, but the price came storming back and is now a stone’s throw away from an even higher high.
.png?width=745&name=Copper%20(2).png)
Source: TradingView
The semiannual chart shows dating back to 1988 illustrates the all-time high came in 2011 at $4.6495, only 31.35 cents above the closing price on April 23.
LME and COMEX stocks rise
Many market participants watch inventory levels for price direction clues.
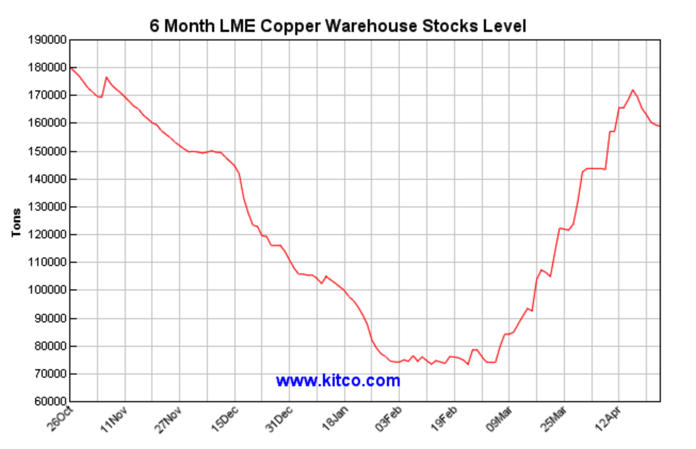 Source: Kitco/LME
The chart shows that after reaching a low of under 80,000 metric tons in late February 2021, inventories in LME warehouses rose to over 170,000 tons in early April. Copper rose to the most recent high when stockpiles were on the lows. As of April 23, the LME reported that warehouse stocks were at the 155,750 level, still well above the February and March lows, but under the recent peak at 172,025 tons. Copper has moved higher despite the stock level.
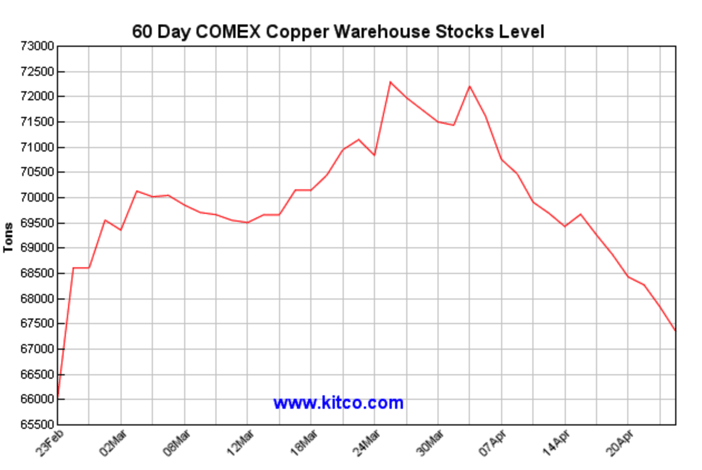
Source: Kitco/COMEX
Meanwhile, COMEX stocks also rose from late February through early April, reaching a high at over 72,000 tons, but have declined to the 67,353-ton level at the end of last week.
Inventories can be a mirage
China is the world’s leading copper consumer. A Chinese company also owns and operates the London Metals Exchange since 2013. Moving stockpiles in and out of exchange warehouses have always been a part of tampering with the copper and other base metals market’s mechanisms. Dominant market participants can create an illusion of supply gluts or deficits by moving metal around the globe. Therefore, I always view significant inventory shifts with more than a grain of salt.
The rise in stocks in late February and early March that pushed the price of copper from $4.3630 to $3.8760 per pound may have been an attempt by buyers to accumulate metal at lower levels by pushing weak holders from long positions.
Inventories can provide some clues about supply and demand fundamentals, but they can also create a manipulated mirage.
Goldman Sachs makes a bullish call- Three reasons for higher copper prices
Jeff Currie is Goldman Sachs’s leading commodity analyst. His team recently released a report calling copper the new oil. The report pointed out the inflation-adjusted higher for the red metal on the London Metals Exchange was in the 1960s at over $14,000 per ton.
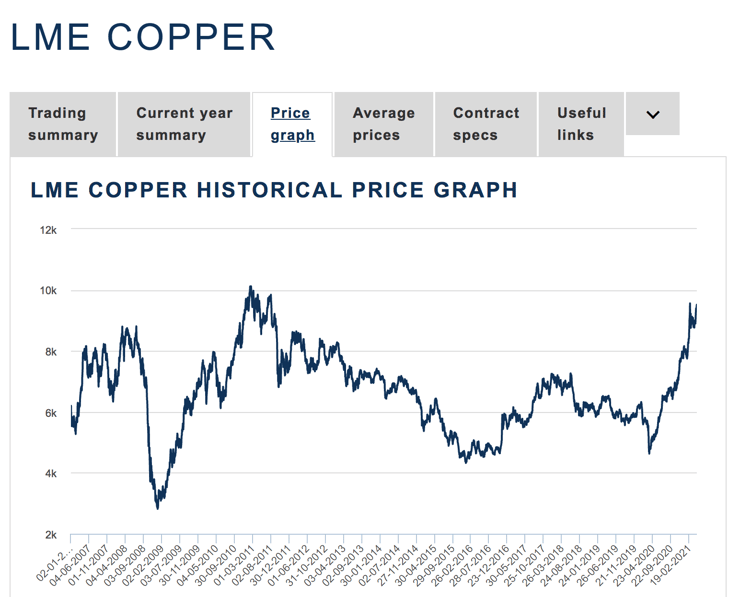
The LME copper chart dating back to early 2007 shows that the high in 2011 was $10,119 per ton level. On April 23, the price of three-month copper was trading around $9,518. Goldman’s report pointed to rising demand and tight supplies. The following three factors support coppers price as it approaches the 2011 high:
- A transition to green energy is bullish for copper as decarbonization depends on the red metal. Copper is a critical component in systems that create wind, solar, and geothermal energy. It is essential for electric vehicles and semiconductors, where there is currently a shortage that will further boost demand.
- China is the world’s leading copper consumer because of its infrastructure building requirements. Copper is crucial for construction. The Biden administration’s $2+ trillion US infrastructure rebuilding program will increase the US demand for the base metal and many other construction materials. We have already seen the lumber price rise to a record high at nearly $1375 per 1,000 board feet.
- Central bank liquidity and government stimulus are highly inflationary as they erode money’s purchasing power. As the money supply grows, fiat currencies lose value. Copper is a leading industrial commodity. Rising inflationary pressures support higher copper prices.
As the price of copper continues to rise, trend-following systems and speculators will continue to flock to the nonferrous metal, increasing the demand side of copper’s fundamental equation.
Heading for new high- Copper could go parabolic
Copper was below the 2011 high on Friday, April 23. The LME price was under $10,000 per ton. Goldman Sachs’ forecast is for $11,000 per ton in the next twelve months. However, as “copper is the new oil,” the longer-term price expectations are far higher as they see demand rising much faster than supplies. Goldman sees copper at $14,000 per ton in 2024 and $15,000 per ton in 2025, over 50% higher than the current price approaching the 2011 high.
Bear markets often take prices far below where logic dictates. If you have any doubt, look at an oil chart from April 20, 2020, when NYMEX futures fell to the negative $40.32 per barrel level during a tidal wave of selling. Bull markets have a habit of moving to levels that are far higher than analysts expect when a buying frenzy creates parabolic moves. Lumber was at $251.51 per 1,000 board feet in April 2020 and moved nearly five and one-half times higher at the recent $1374.70 level. Copper is not the only commodity rallying these days. Grain prices experienced explosive gains last week. Palladium, a thinly traded precious metal, rose to a new record high at $2928 per ounce last Friday.
Copper has bullish winds behind its sails from a fundamental and technical perspective. The red metal looks set to climb to new heights as the copper bull market appears firmly intact. When markets trend, picking a top can be a tragic mistake. Sit back and enjoy the ride, even though it could become bumpy. The risk of corrections rises with prices in bull markets.

Trading advice given in this communication, if any, is based on information taken from trades and statistical services and other sources that we believe are reliable. The author does not guarantee that such information is accurate or complete and it should not be relied upon as such. Trading advice reflects the author’s good faith judgment at a specific time and is subject to change without notice. There is no guarantee that the advice the author provides will result in profitable trades. There is risk of loss in all futures and options trading.