December 31, 2018
Before we get into a review of the important facets of 2018, let’s look back and take a look at last years year end letter and take note of what we foretold. Here is what we wrote as to what we thought was in store for 2018 in terms of the equity markets, “Will the FED’s rate hikes thwart this continued linear equity and debt boom? We don’t think so, we feel that the US equity markets can continue their ascent into double digit percentages once again pushing the SP500 toward the 3000 level and the NASDAQ finally breaking that 7000 mark.”
What we can say with certainty is that the SP500 valiantly attempted to break 3000 but fell short as the high in the complex using futures was 2944.75 March future and, in the NASDAQ, the high in the March future was 7765 pushing it well past the 7k barrier. The tech sector was once again the overall go-to market, as the FAANGs continued their lofty ascent, to only be brought back to reality as smart money began selling in late October. Although the futures markets were looking at some decent gains on the year heading into November, the final two months of the year took all of the gains away. As of this letter and utilizing the futures markets, the SP500 trades at 2497 -6.4% YTD and the NASDAQ trades at 6330 which puts it down 0.8% YTD.
As for the FAANGs, Let’s take a look in order from worst performer to best YTD:
Facebook -43% from its highs and is trading near $130 -26% YTD
Apple -37.6% from its high and is trading near $157 -7% YTD
Google -24% from its high and is trading near $1033 -1.3% YTD
Amazon -36.7% from its high and is trading near $1517 +29% YTD
Netflix -45.2% from its high and is trading near $268 +38% YTD
As you can see even with the massive drop off from their highs, Amazon and Netflix are still up considerably YTD. That should provide you with some scope as to the veracity of out performance by the tech sector in general this year.
Crude Oil was on track for a great year as it drove higher into October, rising some 33% YTD, but then the floor completely fell out from under it and is currently trading near $46, -40% from the highs and -20.3% YTD.
The metal complex saw a brief run up early on in the year but then Gold fell around 11% by mid-year amongst the dollars strength on the heels of FED rate hikes.However, by year end Gold has recovered most of that lost and now trades around $1284 -1.6% on the year. If the FED is indeed near the end of the rate hike campaign and Gold has performed this well thus far, we can only imagine the bulls will continue to press the envelope here. However, don’t count out the other metals, like Silver, which was down 20% by October but now trades $15.54 down 11.5% YTD. Also, of note is Palladium, which after begin down on the year some 22% it now trades at $1197 up 13.3% on the year.
2018 was certainly a year to remember as markets dealt with a massive equity run up in January, to be followed only by a complete VIX inspired market meltdown in February. After that it seemed like the markets crept back into the linear buy the dip algo induced bravado which seemed to be kept somewhat in check by the rhythmic FED and their 25bp rate hikes. The rate hikes continued to pound the US yield curves flatter as the US 2s10 yield curve flattened some 66% on their lows from 55 basis points down to 18 basis points the flattest level since June of 2007. The curve has steepened a bit from those lows as professional bond traders place their bets that the FED is near the end of their campaign and their rosy outlook for continued hikes will be cut short of their mark set forth in their dot plot scheme. As many pundits continue to clamor that an inverted yield curve assures us a recession is near, the long end seems to be well anchored in speculation that further hikes will be quickly retracted.
We have written exhaustively over the last decade in regards to the very simple game plan that the global central banks decided to embark upon. In 2008, with the initial passage of TARP and successive Quantitative Easing programs enacted by all the major central banks around the globe, the era of ZIRP commenced. This precipice, this singularity if you will, vaulted global economies out of the worst debt induced financial disaster since the Great Depression. Investors the world around cheered in joy as asset prices bottomed, and both equity and bond markets rose rapidly. A more astute observer of financial constructs, the Jim Grant, the David Rosenberg’s of the world, saw this as financial largesse at its finest as our central bank overlords swapped corporate and private defaulting debt, with AAA rated government debt in what would become the largest asset grab in history by global central banks.
Anyway, with central banks cutting back their asset purchases and with the Federal Reserve continuing to raise rates, it should be of zero surprise to any investors that the global equity markets have been under attack. Yardeni Research posted a couple of great charts in their December issue and we have one right here:
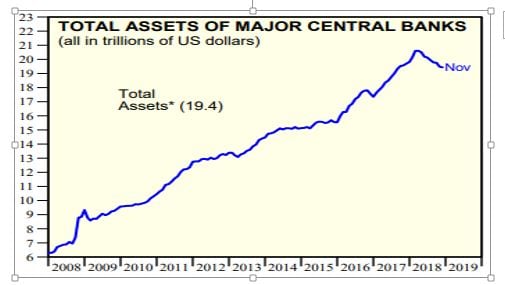
As you can see, 2018 saw more than a trillion dollars being deducted from global central bank balance sheets, just think of this as the first pillar of support to fall from under global equity markets.
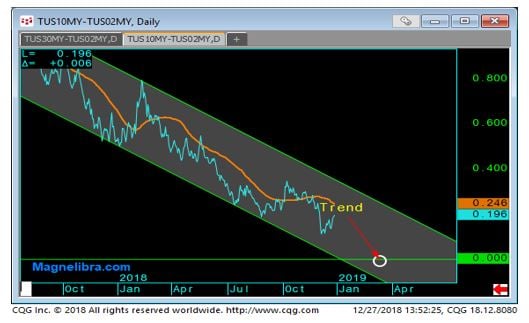
So, to enlighten you with our first call for 2019 the Federal Reserve will raise the Fed Funds rate up one more time to 2.75% inverting the Fed Funds/US 10yr and the US 2s10 yield curve. The 2s10 has been hovering around the 20bp level for the last 5 months but we figure the Fed will raise rates at their March 19/20th meeting finally inverting this curve shown here:
This provides us with the ground work for our second call for 2019 and that is Q1 for the equity markets may see some carving out of this new-found equity market range. Our view is still outright bearish, yet we aren’t naïve enough to just think an outright sell will not go untested. We also figure a whole host of equity support will be coming in January as long-term liability matchers rebalance their portfolios to reflect this new-found equity market discount. When was the last time you could pick up the FAANGs at such depressed levels? Remember many managers are still conditioned by the central bank “put” and “QE” lessons not learned are lessons not followed, so we expect this down turn to be a process, not all at once. Anyway, this SP500 chart shows the lows printing into bear territory but the last week of 2018 may see some salvation:
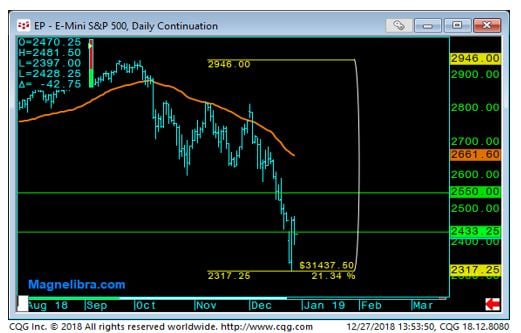
We suspect that the high is in for quite some time, but we will not rule out a run and test from here up toward 2650 in the SP500. Given the fact that the Fed is not expected to hike at the Jan. meeting and that pension fund and insurer rebalancing may provide some decent support, this call seems logical at the moment. Obviously, things can and do change.
This brings us to our 3rd call for 2019 and that is China caves on US tariffs and agrees to some concessions. This would obviously be equity bullish and we see it happening sooner rather than later as Trump is a master negotiator and is playing from the power position, despite the naysayers, we feel the US has the upper hand here. China can ill afford a prolonged tariff spat and its most noted in their foreign reserve usage which continues to dwindle and is less potent at stemming capital flight out of the mainland. You can’t peg your currency and stop capital flight as well, priority is important and we feel China can ill afford to play long ball with the US in this manner.
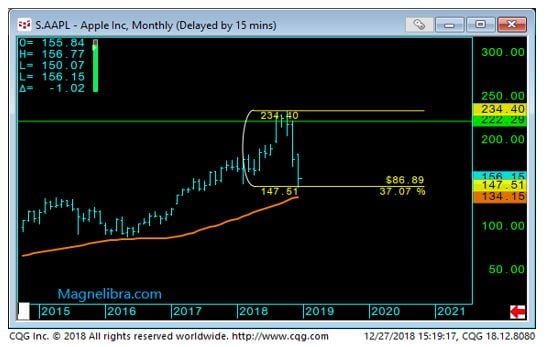
So, we spoke of some of the FAANGs earlier, let’s take a look at some recent price action in Apple. We talked at length this year about Apple and the fact that they have hit peak pricing and that their starting to see margin pressure build. We have also noted that they have virtually staked their whole fate on just one product…never a good business decision, yeah, we know they have billions, but we also know they spend around $14.2 billion a year on R&D. (2018 SEC 10-k) As far as support, a decent low has been hit here at $148 but ultimately the $134 area seems logical:
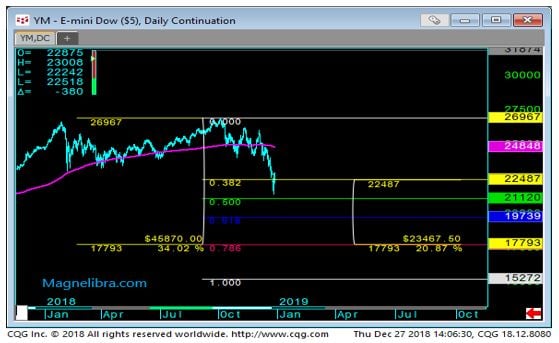
Our next chart is of the Dow, as we mentioned prior, equities have thus far reached some decent supports and now the Dow futures sit right on their 38.2% Fib retrace at 22487. We feel a run up from here to test the 24800 level should bring in new shorts. Ultimately, we think 2019 will see a drop toward the 17800 area where a significant rebound will most likely occur on the heels of further central bank expansion.
So just to recap the equity picture, we feel that Q1 2019 will see a whole host of bottom pickers come into support the markets. First and foremost, the long-term liability players like pension fund and insurers will be rebalancing and adding to their current equity holdings as the recent drubbing will induce such activity. On the flipside of that you have CTA trend following sellers looking to enter into what many now believe is an equity bear market. So, all in all we think the equities move sideways to higher before that fateful March rate hike which will seal their fate. We must be fully cognizant in the midst of this bearish mindset that any positive tariff news will certainly be bullish for equities, so be on the lookout for that as well.
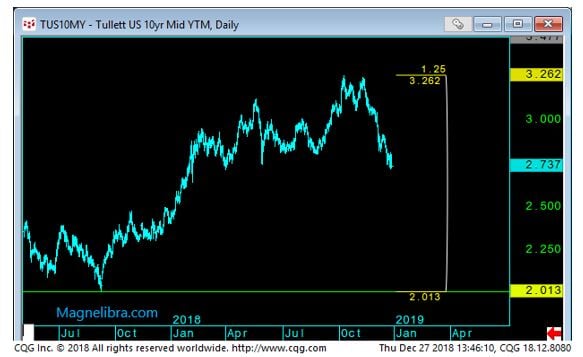
As far as the US government bonds, we touched upon the inversion that we expect in the US 2s10 come March and now we will comment on the US government 10-year bond. The recent break of 3% has seen a huge 30bp run toward the 2.70% area. We expect some back and fill here as equities stabilize short term, but we feel the upside to yields is capped based upon or bearish outlook in equities and the fact that the FED is near the end of their hikes. The astute bond players will put the FED into their place and begin front running future rate cuts, this we feel will most certainly be on the minds of bond traders in 2019. Our target range for 2019 for US 10-year yields are 3.05% to 2.30% with the upper bound most likely seen into the February refunding which will most undoubtedly be massive and the March Fed meeting. The lower bound should be seen later on in the year as the FED pauses and even contemplates reversing course depending solely on the severity of the equity markets moves. 2019 will be characterized by the Feds inability to remove QE and once again, its tendency to run to the only solution it knows, more QE or what we have coined as #QE4EVR. The following chart depicts the US 10-year in yield and shows the large drop of over 53 basis points from the 3.26% high to the current levels of 2.73%. We expect a return to 2.01% in the long run:
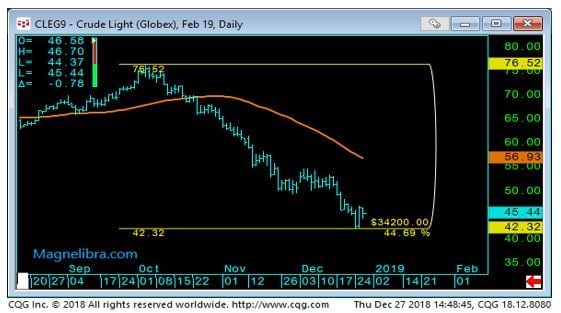
We haven’t really touched upon the energy markets and as we do follow them and considering the absolute about face the Crude market has done this year, we have to opine just a little bit here. We have heard all sorts of production excuses, OPEC arguments as to why Crude basically fell out of bed. Yet we aren’t sure what is the true reason. Could it be that the energy markets are also discounting a global slowdown? This certainly makes sense and so to does the fact that the United States is now the leading producer of oil. In fact, the United States produces nearly 30% more than Saudi Arabia, can you believe it? Did you even know that? The Energy Information Admin. states that the US produces 15.6 million barrels a day compared to 12.1 million for SA. (EIA.gov) Considering this fact and considering this trend is going to continue, perhaps that is more of reason why Crude which we will show in this next chart showing the February futures contract has declined from a high of $76.52 down to its recent low of $42.32 a loss of nearly 45%. Just to put this into perspective, Crude oil was up 35% for the year and is now down 22% what an absolute whip saw! If we stink with our global slow down them, we should see Crude trade around the $50 level for 2019 most likely capped by that 2018 high of $76. Under $40 and we start to see some other dynamics at play, most notably leveraged producers and their debt piles being once again called into question. So not that we expect a prolonged protraction, but when leverage gets tossed into the mix, fire sales can drive prices certainly below fundamentals:
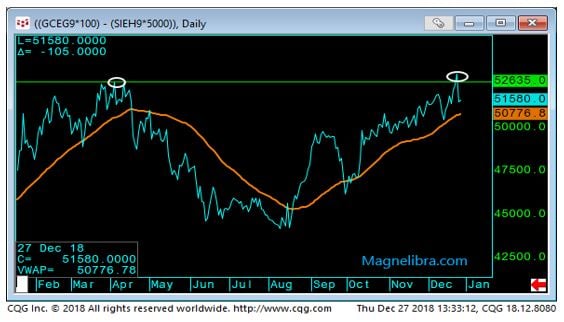
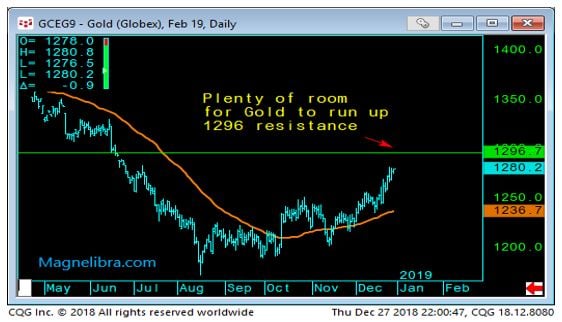
We feel that 2019 will be a great year for the metal market. Gold continues to shine and looks to be in a clear uptrend since the August lows. All this amongst a hiking FED which has also seen the US dollar maintain its strength. 2018 has basically been one big down move in the complex, but the last few months it seems the complex has carved out a nice base and continues to rise. In our most recent note, we highlighted the fact that Gold has been moving higher relative to Silver and recently hit the high of the year in this spread. Noting the double top and prior resistance, Silver has regained some footing vs Gold as depicted in this chart:
 We feel both Gold and Silver will reverse their 2018 fortunes and trade above $1400 and $17 respectively. Here is the February Gold futures chart:
In what seems to be a bizarre and overwhelming contrast in respect to Cryptocurrencies this year from last, we can’t help but comment on the digital asset sector. As 2017 came to a close it was all euphoria in the space and then the floor just absolutely fell out from under it. The speculators that drove the pricing to exponential heights, were taken out feet first with damage so swift and severe many would never recover. Yet we are still bullish on blockchain and its decentralized nature. Innovation in the space will continue and the future will most definitely incorporate blockchain in it one way or another.
As far as treating these assets like financial assets, we can’t help but admit our disdain for such folly. Cryptocurrencies are and never will be financial assets to be swapped for fiat, that is simply a Wall Street incarnation. Rather they are designed as a function of a particular decentralized payment or information system. The titan of these technologies, continues to be Bitcoin. Even after all the damage in 2018 it currently trades at $3600. Many will say it is finished, its worthless, it is down 82% off its highs. If you take that perspective then yes, we can see the doom one sees. Instead, how about we take a different perspective and say, its been around for a decade now, it trades at 3600x the US dollar and its up 21% from September of 2017. What people fail to realize is that Bitcoin is not an asset in a financial sense, to be swapped for fiat, it is a technology where by the required cost of usage is Bitcoin itself.
Now we know the SEC has failed to pass any true merit tests in regards to Bitcoin ETFs, but they do so at the request of undoubtedly the Federal Reserve itself. You see dear reader, Bitcoin is a competitor to fiat money, plain and simple and it is in that fact alone, that all necessary measures will be taken to insure it never becomes mainstream. Whether or not the powers that be succeed is still in question, but for now, we suspect, that blockchain will continue to advance and that Bitcoin will continue to be the preeminent asset amongst its digital peers. So that is our take on it, we are bullish the technology and our only real opinion is that you treat it as a technology and understand that the future albeit uncertain will most certainly have a use for it somewhere. Treat it as a technology never to be converted to fiat, end of story.
That covers most of what we expect from our financial market perspectives. The other things we are keeping an eye out for in 2019 are more scientific in nature. Some of the key words you should be aware of are, grand solar minimum, cosmic rays and plasma physics. Expect climate change to be placed at the forefront, not because we can actually do anything about it, but because the natural cyclicality of our climate is about to make a drastic change. They want people to be aware of these changes and they will most likely have a great effect on the volatility of our weather and stress on our food supplies and power grids as well. Humans often neglect out of sheer hubris that giant ball of hydrogen plasma in the sky, it has the final say in our temperature, as for humans, well, the great George Carlin said it best:
"We’re so self-important. So self-important. Everybody’s going to save something now. “Save the trees, save the bees, save the whales, save those snails.” And the greatest arrogance of all: save the planet. What? Are these effing people kidding me? Save the planet, we don’t even know how to take care of ourselves yet. We haven’t learned how to care for one another, we’re gonna save the effing planet? (George Carlin)
Be on the lookout for increased volcanic activity, all of this is related in some way, so we want you to be aware of it. You have been sold that the Earth is warming, but like markets, the Earth has cycles as well, periods of warming and periods of cooling. Our job is to peak your interest in things we believe matter, and these things matter!
We hope you have a very safe and joyful New Year, cheers!
Capital Trading Group, LLLP ("CTG") is an investment firm that believes safety and trust are the two most sought after attributes among investors and money managers alike. For over 30 years we have built our business and reputation in efforts to mitigate risk through diversification. We forge long-term relationships with both investors and money managers otherwise known as Commodity Trading Advisors (CTAs).
We are a firm with an important distinction: It is our belief that building strong relationships require more than offering a well-rounded set of investment vehicles; a first-hand understanding of the instruments and the organization behind those instruments is needed as well.
Futures trading is speculative and involves the potential loss of investment. Past results are not necessarily indicative of future results. Futures trading is not suitable for all investors.
Nell Sloane, Capital Trading Group, LLLP is not affiliated with nor do they endorse, sponsor, or recommend any product or service advertised herein, unless otherwise specifically noted.
This newsletter is published by Capital Trading Group, LLLP and Nell Sloane is the editor of this publication. The information contained herein was taken from financial information sources deemed to be reliable and accurate at the time it was published, but changes in the marketplace may cause this information to become out dated and obsolete. It should be noted that Capital Trading Group, LLLP nor Nell Sloane has verified the completeness of the information contained herein. Statements of opinion and recommendations, will be introduced as such, and generally reflect the judgment and opinions of Nell Sloane, these opinions may change at any time without written notice, and Capital Trading Group, LLLP assumes no duty or responsibility to update you regarding any changes. Market opinions contained herein are intended as general observations and are not intended as specific investment advice. Any references to products offered by Capital Trading Group, LLLP are not a solicitation for any investment. Readers are urged to contact your account representative for more information about the unique risks associated with futures trading and we encourage you to review all disclosures before making any decision to invest. This electronic newsletter does not constitute an offer of sales of any securities. Nell Sloane, Capital Trading Group, LLLP and their officers, directors, and/or employees may or may not have investments in markets or programs mentioned herein.