November 15, 2021
By Andrew Hecht
- We covered processing spreads, term structure, location, and quality spreads
- Substitution spreads are another part of market structure
- The platinum versus gold spread- Financial substitution leads to value assumptions
- Oil, coal, and natural gas- Energy substitutes can reveal clues
- Think outside the box when analyzing a commodity- It’s all about choices
Market structure is the various puzzle pieces that can reveal valuable clues about the path of least resistance of prices. Fundamental analysis involves pouring through supply and demand data to forecast price direction. However, market structure can simplify the process as each jigsaw puzzle piece will complete an emerging picture. Market structure reflects price relationships that develop over time. Each commodity has idiosyncratic supply and demand characteristics. Price differentials in intra or intercommodity spreads can assist market participants in arriving at high-odds directional forecasts.
We covered processing spreads, term structure, location, and quality spreads
Over the past weeks, we have looked at how processing spreads provide clues about the supply and demand side of a commodity’s fundamental equation. We looked at term structure, backwardation, and contango and how price differentials for one delivery date versus another are real-time indicators of deficit or glut conditions. Location spreads shed light on the price of a commodity in one region versus another, while quality spreads tell us how different compositions or sizes can influence prices compared to benchmarks and put upward or downward pressure on futures prices.
Those spreads are all intra-commodity spreads. This week, we will investigate how inter-commodity spreads play a role in price direction. Substitution spreads reflect the price of one commodity versus another when they can serve the same or similar purposes when prices dictate.
Substitution spreads are another part of market structure
Markets reflect the crowd’s wisdom. Crowds tend to be wise consumers; they search for value and the best deal. When the price of a commodity rises to a level where a substitute makes more economic sense, many consumers will alter their buying behavior. Think of a trip to the supermarket. When shoppers plan to make a juicy steak for dinner and find out that a pork chop is a far better economic choice, they often choose pork over beef.
I like to call the live cattle versus lean hog futures spread the what’s for dinner spread, and it is an inter-commodity, substitution spread.
 Source: TradingView
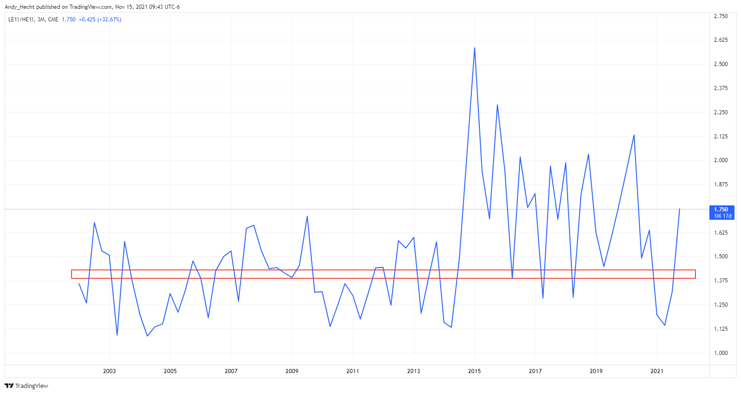
The quarterly chart of the price of live cattle futures divided by lean hogs shows that while the spread has an upward bias, the long-term average or pivot point is around the 1.40:1 level or 1.4 pounds of pork value in each pound of beef value. When the spread is above 1.4:1, pork is a wiser economic choice for consumers; when below the mean, beef is the optimal choice. While the spread can diverge from the midpoint, it has tended to revert to the norm since the turn of this century.
 Source: TradingView
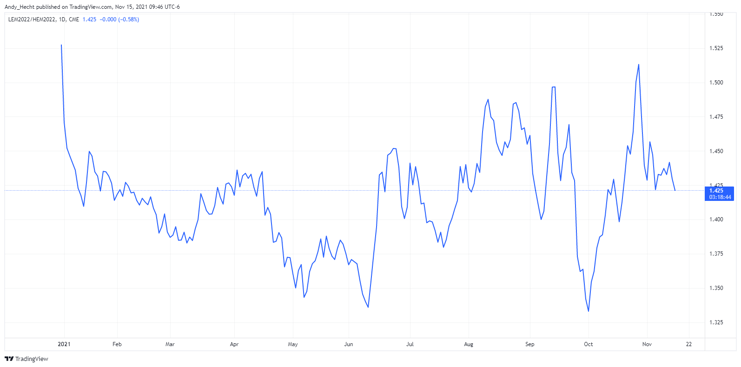
The chart of the June 2022 live cattle lean hog spread shows the relationship is right around the long-term average, indicating that beef and hog prices are at a long-term “fair value” level.
The beef versus pork spread is an inter-commodity barometer for consumer behavior. Meanwhile, the corn-soybean inter-commodity spread can serve as a guide for producer behavior.
 Source: TradingView
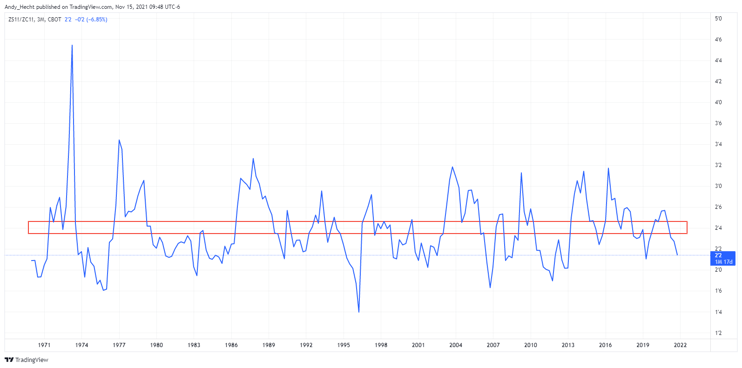
The chart of the price of nearby soybean futures divided by corn futures shows that the pivot point dating back to the late 1960s is around the 2.4 bushels of corn value for each bushel of soybean value. Farmers are business people who work each crop year to create the optimal return on their acreage. Many can plant either corn or beans on their land. They grow the crop that offers the best return. When the corn-bean ratio spread is above 2.4:1, soybeans tend to provide the best financial result; when below the pivot point, corn is the more profitable choice.
The corn-bean relationship is most useful when looking at new crop futures before and at the beginning of the annual planting season.
 Source: TradingView
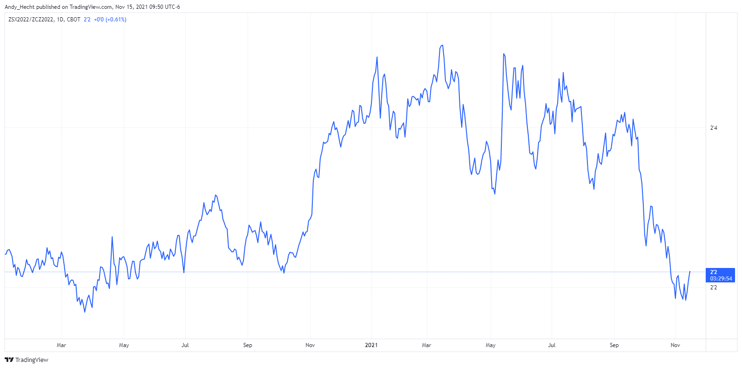
The chart of the price of new crop November 2022 soybean futures divided by new crop December 2022 corn futures illustrates at below 2.26:1, on November 12, 2021, farmers are more likely to plant corn than beans as the coarse grain is more expensive and offers a better historic return than the oilseed.
The meat and grain inter-commodity spreads are guides. Many other factors could influence the levels, which are additional variables in the calculus of analyzing commodity prices. For example, a pork shortage in China because of disease could lift pork prices, or an outbreak that impacts cattle could do the same to beef. Since corn is the primary input in producing US ethanol, the shift in US energy policy could shift the corn-bean spread for fundamental reasons. However, these types of spreads that measure current price relationships versus historical means can be a helpful tool that may validate other assumptions.
The platinum versus gold spread- Financial substitution leads to value assumptions
In the world of precious metals, platinum and gold have far different supply and demand characteristics, but the two precious metals share some similarities. Platinum and gold have industrial applications, while they also have financial properties as means of exchange and stores of wealth for investors.
It is a challenge to label the price of any commodity cheap or expensive because the current market price is always the correct price as it is the level where buyers and sellers meet in a transparent market, the exchange. However, comparing the price of gold to platinum allows us to use the terms cheap and expensive on a historical basis.
 Source: TradingView
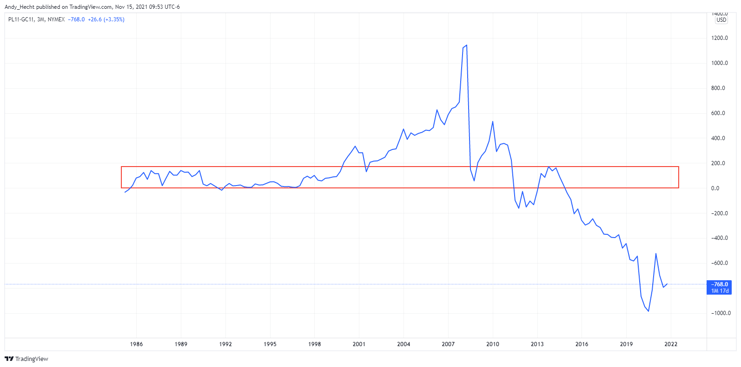
The chart of the nearby platinum futures price minus the nearby gold futures price dating back to the early 1970s shows that from 1974 through 2014, platinum mostly traded at a premium to gold. While the spread has been as high as over a $1,000 premium for platinum to as low as a $1,000 discount to gold over the period, over the past 47 years, platinum has traded at a premium to gold nearly 85% of the time. It has only been over the recent seven years, since 2014, that platinum has been lower than the yellow metal. Many factors can explain platinum’s weakness versus gold, but on a historical basis, platinum is historically inexpensive compared to its precious yellow cousin.
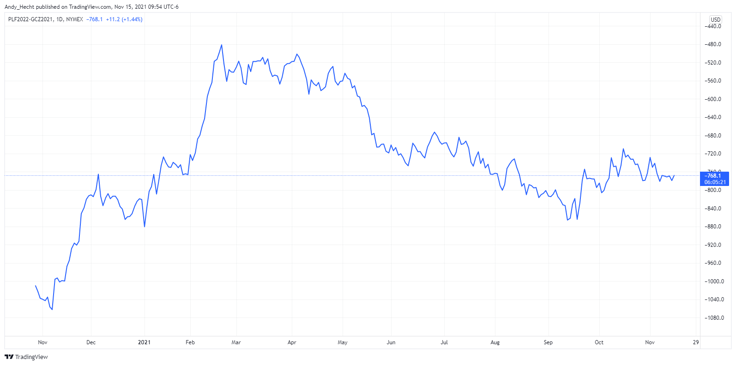 Source: TradingView
At a $780 discount for platinum compared to gold, some investors have been stockpiling platinum because the inter-commodity spreads reflect compelling historical value for the metal.
Oil, coal, and natural gas- Energy substitutes can reveal clues
Energy prices can be highly volatile. While the world moves to address climate change by reducing the production and consumption of fossil fuels in favor of alternative renewable energy sources, hydrocarbons continue to power the world. When it comes to electricity production, power generation can come from many different sources. The world may be moving towards solar, wind, hydroelectric, and nuclear generations, but oil, gas, and coal continue to be significant energy sources.
Coal has been a four-letter word for many years, and many mining companies abandoned coal mining. The recent surge in oil and gas prices caused an almost perfect bullish storm in the coal market. Low supply levels and rising demand pushed prices to record highs in October.
 Source: TradingView
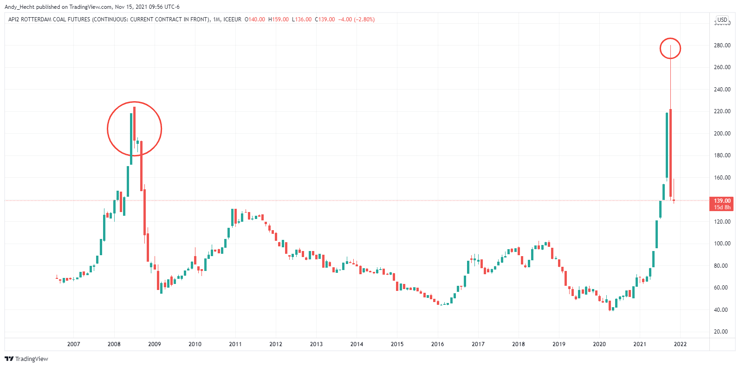
The chart of thermal coal for delivery in Rotterdam, the Netherlands, shows the rise to a high of $280 per ton in October 2021, surpassing the 2008 $224 previous high. The spike higher in coal was a function of rising oil and gas prices, which is the essence of the inter-commodity spread within the fossil fuel sector.
Crude oil and natural gas are highly volatile commodities. There is always the potential for substitution when prices diverge from historical means.
Source: TradingView
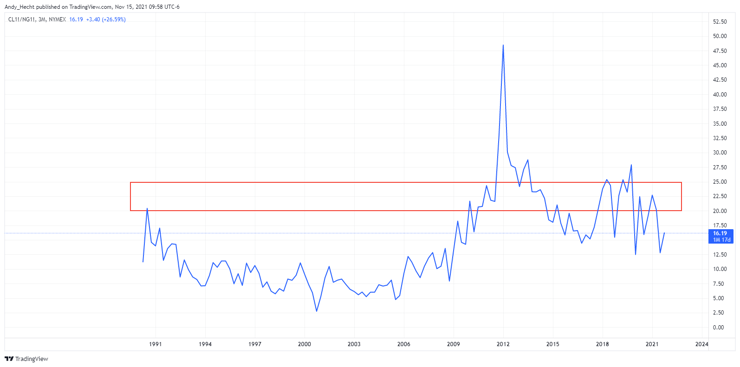
The quarterly chart of the price of nearby NYMEX crude oil futures divided by the price of nearby NYMEX natural gas futures shows that the average of the high and the low since 1990, when natural gas futures began trading, is around the 20-25:1 of the natural gas price measured against the crude oil price. Below that band, natural gas tends to be historically expensive, while above the average level, crude oil becomes historically expensive compared to gas.
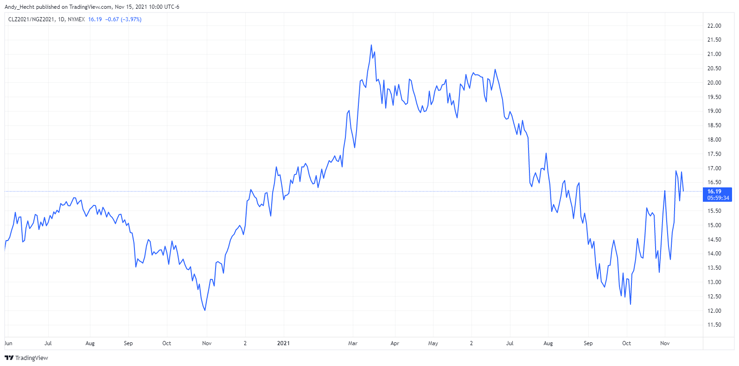
Source: TradingView
The daily chart of the relationship in the December futures contracts shows below the 17:1 level; natural gas is cheaper than oil based on the historical relationship over more than three decades.
Think outside the box when analyzing a commodity- It’s all about choices
Inter-commodity or substitutions spreads create a basis for comparison. Many other factors can explain deviations from historical norms but understanding and comparing the current levels to history is a valuable tool that can lead to a more robust level of analysis.
On their own, substitution spreads are insufficient to make conclusive trading or investing decisions as deviations can last for years or even decades, moving pivot points higher or lower. However, used in conjunction with processing spreads, term structure, location, and quality spreads, they are another puzzle piece that can reveal and validate assumptions about the path of least resistance for a commodity’s price.
I will be off next week but will return on Monday, November 29, with the final piece in this series and the final piece of the puzzle, the power of the crowd.
Trading advice given in this communication, if any, is based on information taken from trades and statistical services and other sources that we believe are reliable. The author does not guarantee that such information is accurate or complete and it should not be relied upon as such. Trading advice reflects the author’s good faith judgment at a specific time and is subject to change without notice. There is no guarantee that the advice the author provides will result in profitable trades. There is risk of loss in all futures and options trading. Any investment involves substantial risks, including, but not limited to, pricing volatility, inadequate liquidity, and the potential complete loss of principal. This article does not in any way constitute an offer or solicitation of an offer to buy or sell any investment, security, or commodity discussed herein, or any security in any jurisdiction in which such an offer would be unlawful under the securities laws of such jurisdiction.