July 12, 2018
Will the Velocity of Money Finally Rise?

Last week we saw NFPayrolls rise 213k above the 195k that was widely expected. May’s payroll report was also revised higher by some 21k to 244k. One weak spot was that the unemployment rate saw a .2% up tick to 4.0% and the average hourly earnings
which saw a 0.2% increase with yoy rising only 2.7%, was a percentage point less than expected. Manufacturing and construction continued to lead the charge as yoy figures show them adding 285k and 282k jobs respectively. (WSJ)
The other noteworthy news item last week was the highly anticipated “Fed Minutes.” The Fed continued to convey the “strong economy” theme and that gradual rate hikes are still necessary. Officials were obviously concerned with the economic risks associated with the current administrations trade policies. Inflation doesn’t seem to be that pressing and that the yield curve will and should be monitored given the historical relationship of increased risks of indicating a recession. Zerohedge posted a chart of the 2s30 which we have here showing a nice 33% reduction in a little over a month from 60bp to 40bp: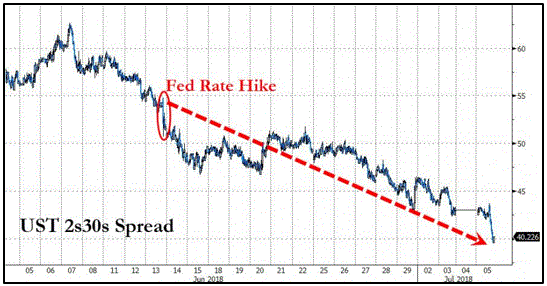
We must remember that the Federal Reserve still pays IOER and thus continues to subsidize the banks. We updated our data recently and we found two charts that truly standout to us. The first one here is the fact that excess reserves continue to plummet and if inflation can’t pick up with ER falling, then deflation must be a massive hidden and underlying thorn in the Fed’s side: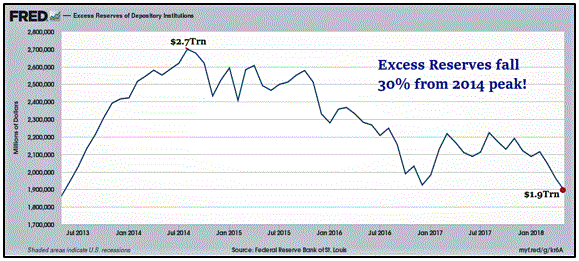
With excess reserves falling, we weren’t surprised at this headline from Monday’s WSJ “Businesses crank up borrowing at banks.” YoY Q2 growth rate was a robust 5.5%. If you don’t know, bank credit is the real driver of GDP growth and considering excess reserves have been in lockdown, it is refreshing to see it starting to trickle into the aggregate economy. Will the velocity of money finally rise??? We believe it will, especially if the FED stays the course. Let the battle of deflation/inflation begin!
The other chart we want you to see displays the value of the Interest on Excess Reserves. As the ER falls and the Fed Funds rises, the subsidy doesn’t grow as fast. We wonder if the banks competition for deposits is starting to heat up and forcing them to finally up their interest payments. As for now the dollar value of the IOER with a rate of 2% is $37.9 Billion per year: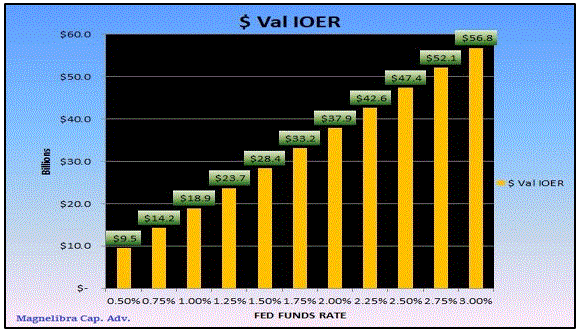
Given the Fed’s intent on continuing their path to higher rates, we can’t help but think the yield curves will invert and at what point will these higher short rates start to steal some of the equity markets thunder. We believe there are some obvious signs of equity stress, especially in the emerging markets and even the DAX this year has lagged quite considerably. Dare we mention the Shanghai Composite class A shares, well here’s a chart and if you think the #MAGA #HigherRates don’t matter, think again: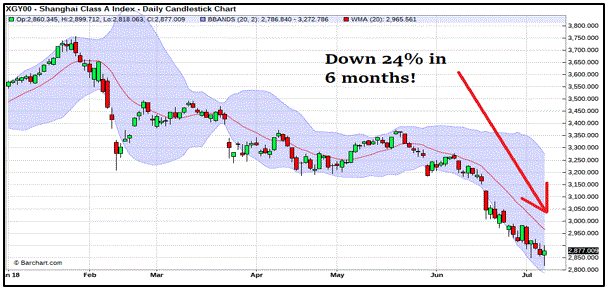
In the German DAX case, we believe the underperformance is more of a function of out of whack, artificially induced interest rate differentials, but that’s a story for another time.
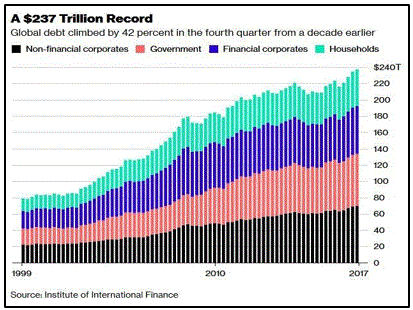 Anyway with the world awashed in so much debt, as interest rates rise and curves flatten, DEBT will once again come to the forefront as both the protector of value as well as the destroyer. We know which side we would rather be on. It is in this duality of debt & credit that people often get confused. Debt can be good, but too much of a good thing is always bad. When it comes to global debt levels, the likes of Keynesians every where should be taken back just a bit by this chart and yes that includes you Mr.Krugman, as we hit record levels.
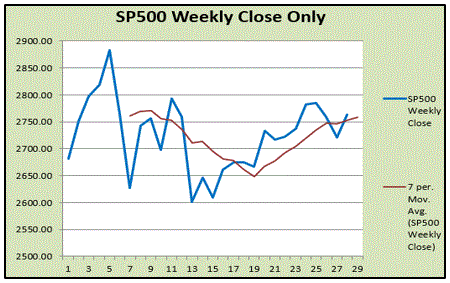 Moving along, we thought it best to update you with the current market data as opposed to last weeks futures settles. We talked a bit about the importance of this week and a close back above the 2750 level in the Sept. EminiSP and here is our weekly raw data chart, which shows last Friday’s close did indeed close above the 2750 mark. We thought the buyers had no choice here, defend at all cost or risk a revisit to the lows.
With this new found optimism we can’t help but think that the continued jawboning geopolitically out of the US and China will dampen any such rallies in the space. We truly believe that the repercussions of a sustained trade war will affect things more than people are currently prepared for. Just this week Trump announced a fresh $200 billion in tariffs to be enacted over the coming weeks. As we talked about last week, we know Trump only negotiates from power positions and we know that higher interest rates and a stronger US Dollar are hardly a recipe for sustained Chinese import/export relationships. The Chinesse will be forced to act in retalliation, but in reality, they are stuck, their domestic economy is not advanced enough to sustain a prolonged fight. Their credit markets in our opinion are not robust enough, or validated in regards to counterparty risk as the shadow banking sector is most certainly riddled with massive hidden bad debt. One concern we do have is and will always be a further escalation in tensions, we just hope calmer heads prevail.
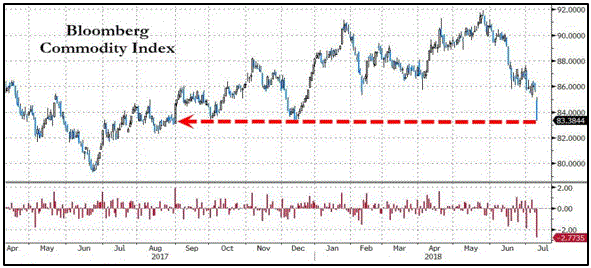
Anyway when we look to today’s action we can see that the overall global macro picture has taken quite a hit. Which reminds us that we must show you this chart that we saw on zhedge today of the Bloomberg Commodity Index. What a tale of 2 quarters this was, after posting a decent 10% up move, it is now unchanged on the year. Is this more central bank posturing by the US vs the PBOC? We know the Chinese stock pile commodities in hopes of solidifying price protections, but considering the falling prices, is collateral going to be called into question? We are actually surprised at this move considering the global outlooks as well as the extreme weather wreaking havoc across the globe, especially on crops. So we aren’t really sure of the underlying motive driving this sell off here, but here is the chart:
Here are the futures settles for Wednesday July 11th 2018: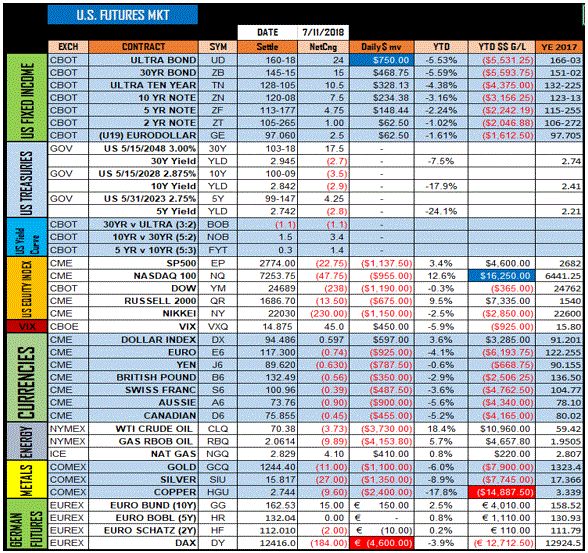
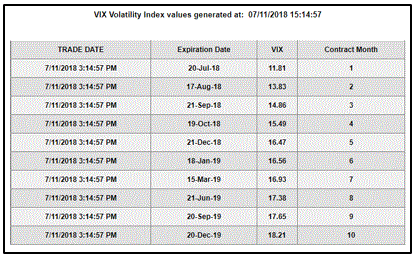
We have a new edition to our Futures coverage, the CBOE Vix futures. We are going to cover this market in hopes of gaining further insight to our audience in terms of the structure of volatility and its effect on expected risk/return profiles for equity indexes. We plan on utilizing a couple different sources to give you a better picture of the VIX term structure and its current levels in hopes of building a better relationship to the indexes and volatility. When we look at the Vix term structure we can better gauge investor sentiment on expected volatility moving forward.
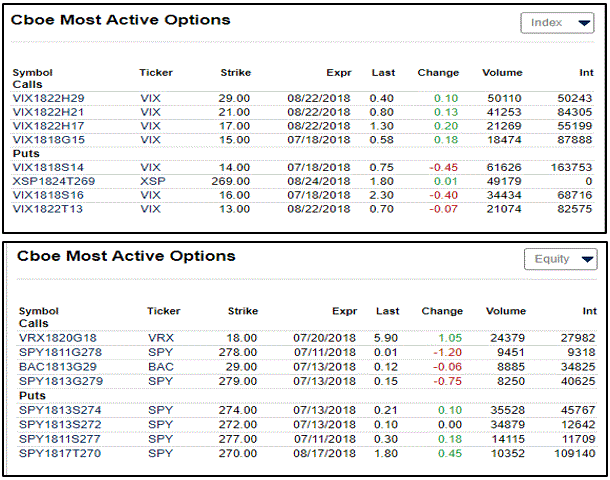
We will cover things like the CBOE most active options in both the Vix as well as the Equity option space as well:
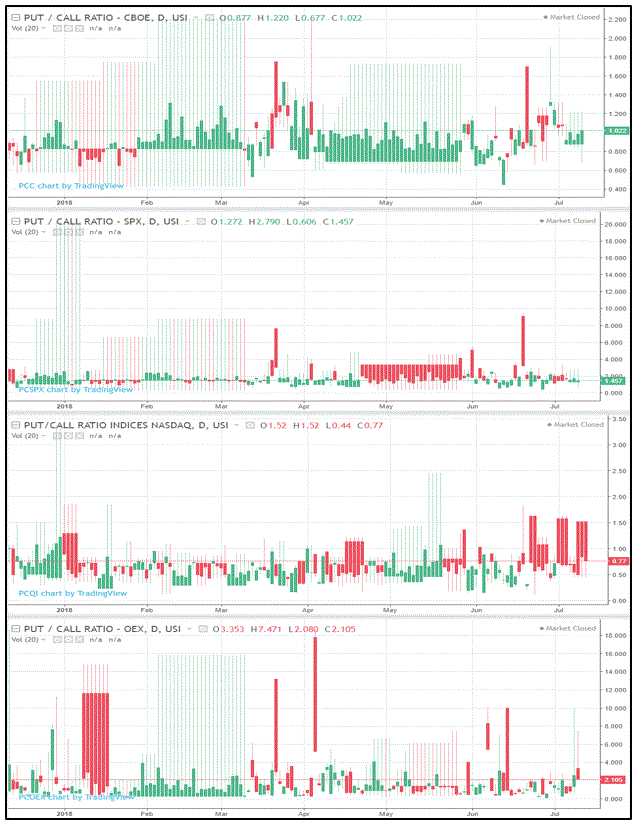
We will cover put/call ratios from the CBOE,SPX,NAS & OEX:
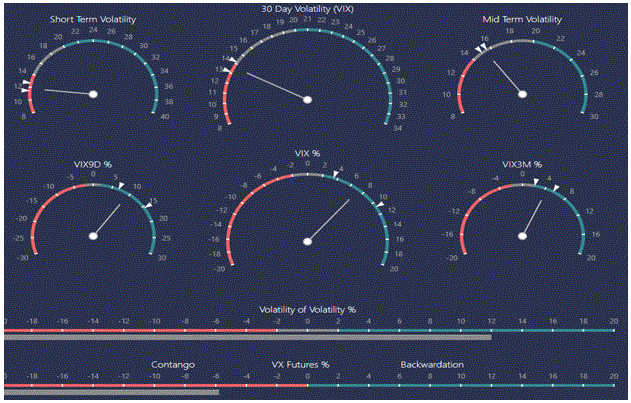
Volatility dash board:
The R2000 Index has shown weakness all day today: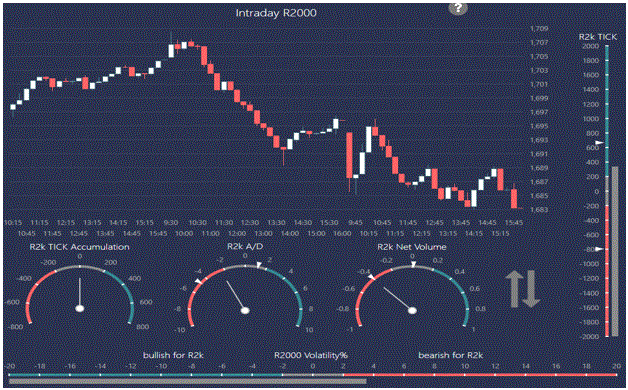
Here is the current CBOE SPX Vol matrix:
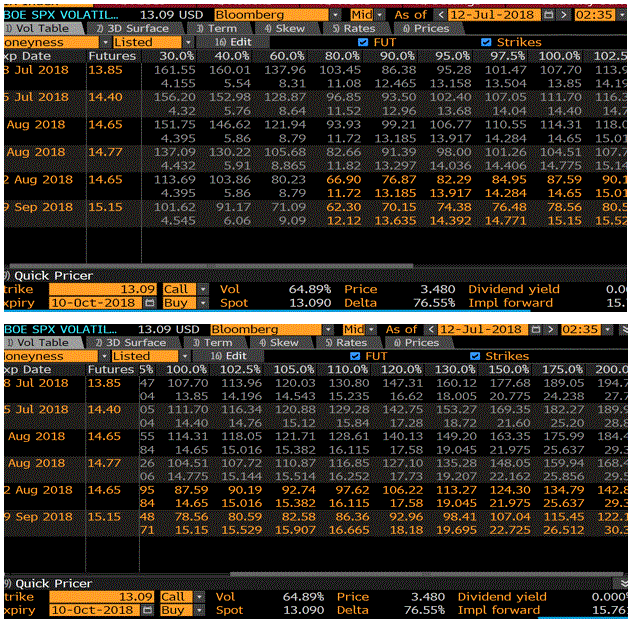
The VIX has obvious supports down at 12.00 with value area 14.00 an obvious magnet for those watching intently on any action above this level, which may lead to further upside probes: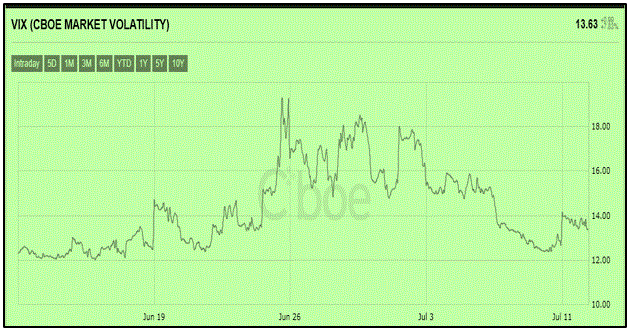
The EminiSP has initial support at 2767 with upside 2787 as key:
Today’s market action saw the energies take a beating as August Crude Oil and RBOB both lost heavy ground, down $3.73 and 9.89 respectively. The metals were also solidly hit and copper continues to get destroyed as it is now down nearly 18% on the year as the US Dollar Index rose to 94.48.
As far as the Crypt Currencies, last weeks settles are shown here to the right. Bitcoin had a decent up week rallying 12% but the standout was NEO up 32%. We continue to look for the crypto currencies to search for a clean bottom. When we look at our CC index it broke out above our moving average. However, this week will either confirm it or put us back into further consolidation to lower mode, so we will monitor it closely:
Some late crypto news, saw Litecoin foundation acquires a 10% stake in Germany’s WEG Bank AG via its strategic partnership with the firm TokenPay. The ecosystem is growing and further strides into standard banking are increasingly likely to occur as time moves on. You can read the article Here
Ok that should do it, just a couple of final tidbits, we look forward to watching the final world cup match between France and Croatia. Congrats to Croatia as they barely squeeked by Iceland and took two penalty shootout wins and finally a come back victory vs England to reach their first ever World Cup Final. On the flipside, France took out Argentina, a formidable conquest in of itself and then a tough battle with Belgium to secure their seat at the final. Anyway Sunday in Moscow, should be a good one! On another note, we read that Starbucks is getting rid of the plastic straws, we can’t help but think what are all the lipstick wearing teeth whitening woman going to do now! Let the complaints begin! We are also looking forward to a speedy confirmation of Trumps latest hand picked SC judge, Brett Kavanaugh whose conservative record will most certainly push the SC decisions to the right. Ok that’s it folks, send us your comments, your thoughts and we thank you for reading our market insight week in and week out, cheers!
Capital Trading Group, LLLP ("CTG") is an investment firm that believes safety and trust are the two most sought after attributes among investors and money managers alike. For over 30 years we have built our business and reputation in efforts to mitigate risk through diversification. We forge long-term relationships with both investors and money managers otherwise known as Commodity Trading Advisors (CTAs).
We are a firm with an important distinction: It is our belief that building strong relationships require more than offering a well-rounded set of investment vehicles; a first-hand understanding of the instruments and the organization behind those instruments is needed as well.
Futures trading is speculative and involves the potential loss of investment. Past results are not necessarily indicative of future results. Futures trading is not suitable for all investors.
Nell Sloane, Capital Trading Group, LLLP is not affiliated with nor do they endorse, sponsor, or recommend any product or service advertised herein, unless otherwise specifically noted.
This newsletter is published by Capital Trading Group, LLLP and Nell Sloane is the editor of this publication. The information contained herein was taken from financial information sources deemed to be reliable and accurate at the time it was published, but changes in the marketplace may cause this information to become out dated and obsolete. It should be noted that Capital Trading Group, LLLP nor Nell Sloane has verified the completeness of the information contained herein. Statements of opinion and recommendations, will be introduced as such, and generally reflect the judgment and opinions of Nell Sloane, these opinions may change at any time without written notice, and Capital Trading Group, LLLP assumes no duty or responsibility to update you regarding any changes. Market opinions contained herein are intended as general observations and are not intended as specific investment advice. Any references to products offered by Capital Trading Group, LLLP are not a solicitation for any investment. Readers are urged to contact your account representative for more information about the unique risks associated with futures trading and we encourage you to review all disclosures before making any decision to invest. This electronic newsletter does not constitute an offer of sales of any securities. Nell Sloane, Capital Trading Group, LLLP and their officers, directors, and/or employees may or may not have investments in markets or programs mentioned herein.
