October 4, 2017
We decided to start this week's letter with the latest data put out from the Federal Reserve's latest "Survey of Consumer Finance." The headline data posted shows that the share of overall wealth of the top 1% of Americans was 38.6% and the other 90% of Americans held just 22.8%, which means that the wealthiest 1% of this country are some 70% richer than the other 90%. We have said all along that the QE policies of central banks have benefitted only the top 1% in terms of income distribution. This isn't the type of capitalistic distribution I think general Americans had in mind from their monetary printing overlords. However, we know that the inevitability of such an outcome was almost guaranteed.
We have written exhaustively on this subject and it is one of the reasons many don't understand why the equity markets continue to rise. As we talked about last week, the risk is now moving to central banks and their respective governments and away from private wealth generators, or public companies. Even more so is this largesse beneficial in private equity land where capital is clearly abundant and as such, begets the reduction in public shares available as M&A pushes for alpha and yield and thus must consolidate, stream line, strip down and trim to mask the lack of true productivity.
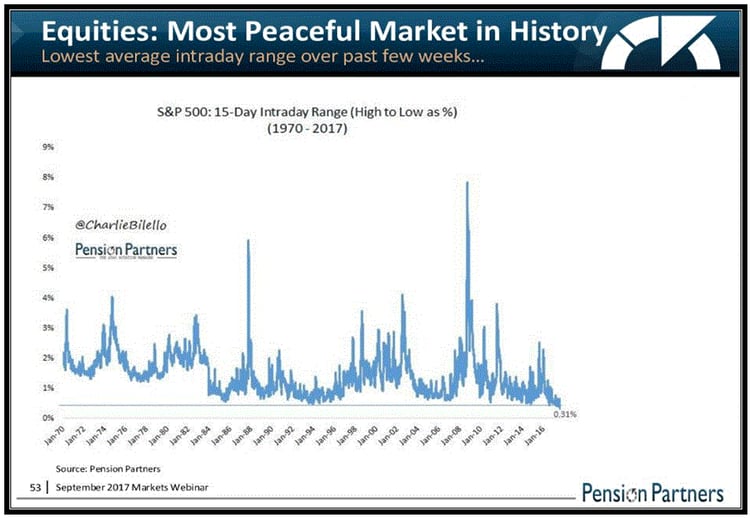
We offer such data, not to frustrate the commoner, but rather to reinforce the driving principles behind the market movement, or shall we say lack thereof. This lack of volatility is not only present in the volatility indexes themselves, but straight up and obvious, especially in equity land, where the moves are quite linear as the ultra wealthy are flooding their excess cash in a constant compounding investment at its finest, buying frenzy. The equity markets have become the de-facto new money market as many are calling it. Pensions Partners put out a great webinar this week and we have this chart from them that distinctly displays the lack of volatility in the SP500 market:
Also out this week was a precursor to the Trump tax plan, where we hear the usual rhetoric of "middle class" tax deductions, lower corporate rates, a simplified tax code, yadda, yadda, yadda. The usual broad stroke feel good stuff we've come to expect out of Washington, Republicans and Democrats alike. We are interested to see any info on carried interest and repatriation exemption, so details in the coming weeks to follow. Will they actually get it done, considering the usual DC gridlock style, we doubt it. It will most likely come as some stripped and watered down version like everything else, oh yea, not without some added pork for the well connected of course.
Hey we don't want to rain on the equity parade, in fact let's highlight the IPO of the week, none other than ROKU. Roku is in the digital media space, providing streaming data from various providers directly to you for your viewing pleasure. The company had nearly $400 million in revenue last year, but posted a net loss of almost $43 million. Hey, who cares about losses, right? Anyway here is the chart as it posted a nice opening day expected to open around $15 and rallied up to $23 with a market cap of $2.2 Billion: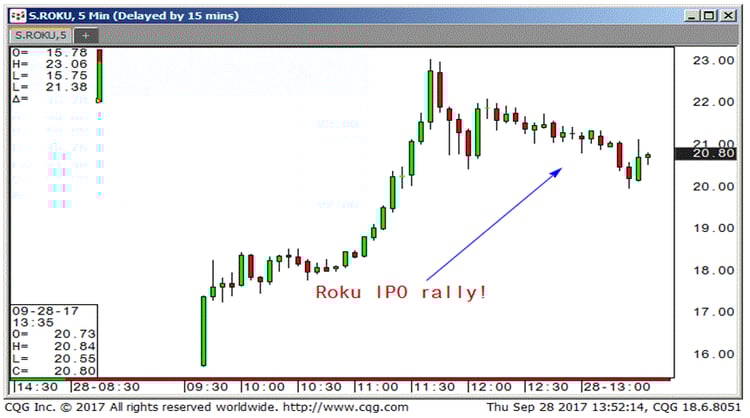
We hate to say it time and time again, that we aren't surprised at valuations and euphoria considering the amount of capital that is at the disposal of the very few. We must also consider the fact that US equity margin debt is 3x that of 2008 and even higher than the tech bubble of 2000, but according to a WSJ article by Paul Davies, "equities would have to fall some 20 to 30% before those margin loans fall underwater." So there is room for error here and all those banking on all this over hyped fundamental value indicator stuff, we hate to say it, but none of that matters in a QE, 1, 2, 3 world. Not really, but we know the facts and that is a debt problem is being solved with more of the problem and there ain't nothing we can do about it!
Also out of the WSJ an article this week by Mike Bird which highlighted the collapse in global bond yields via the ECBs stimulus programs which include a negative interest rate policy. This is forcing European investors into foreign bonds like US Treasuries. We feel as if it's all just a juggling act from global central banks, as one bank raises rates, one provides stimulus and one day they will just switch places, all the while causing asset price volatility in the respective tightened domestic economy. So who needs organic real earnings when we can just print all this prosperity, well not all this prosperity, just top 1 % prosperity. We hate to sound so damn cynical, but it's hard not to right? So let's move back to the reality of our situation and in the next few paragraphs, we will outline the fact that the FED is indeed not tightening when it raises but rather is loosening policy. Yes, we know, its counterintuitive and we know all you academic types are saying, Huh, what the hell are we saying…but trust us, raising rates is adding liquidity not reducing it and we will demonstrate it thru the lens of the IOER function. (IoER: Interest Rate paid On Excess Reserves)
With excess reserves at $2.24 Trillion, up some 16% in 2017, we can't help but think that the real reason the Federal Reserve has to raise rates, is to continue to fund these zombie banks. We read today that Citi is now back above JPM as the largest derivatives player. We can't confirm the accolade, but none the less, we can't help reminisce back to 2007 and feel that once again, it’s the tax payers that will be left holding the trillion dollar bag. So without further adieu and to give you a nice visual as to the amount of money these banks are getting via the IOER function from the FED itself here is our updated chart with all the present numbers: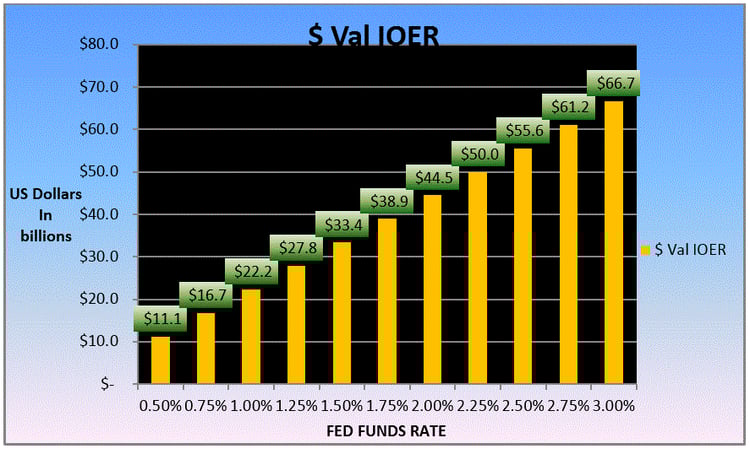
When the Fed raises rates in December, which odds now sit firmly above 50% near 75% in fact, at a 1.50% Fed Fund rates, the FED will be paying Domestic and Foreign banks $33.4 Billion dollars a year in IOER. This is free money the FED is allocating directly to the banks for doing absolutely nothing. Well not nothing, but not loaning to Joe Six-pack that's for damn sure. Why is the FED so willing to do this? Because they know that if they did not do it, the banks would have no choice but to lend out capital to the masses and cause massive inflationary pressures, by which the self feeding destruction from real inflation would wreak havoc on asset prices and debt across the globe. The truly sad reality is that no matter what the global central banks do, it will not stop the eventuality of that re-pricing, but rather merely delay its inevitability. If the banking sector hasn't had enough to worry about with block chain. Then again, maybe this is an added ulterior motive for the free money. A last ditch effort for a dying breed, perhaps? Bitcoin anyone, Sir Jaime?
Anyhow this IOER mechanism should make any true Austrian Free Market believer sick to their stomach. Hell if the commoners understood more, wait, that will never happen, but it was a thought, even just for a brief half a second. So the question that we have solved for you reader and you Joe Blow investor is when it comes to following the money, we have a pretty straight forward visual for you. We present this Circle Function: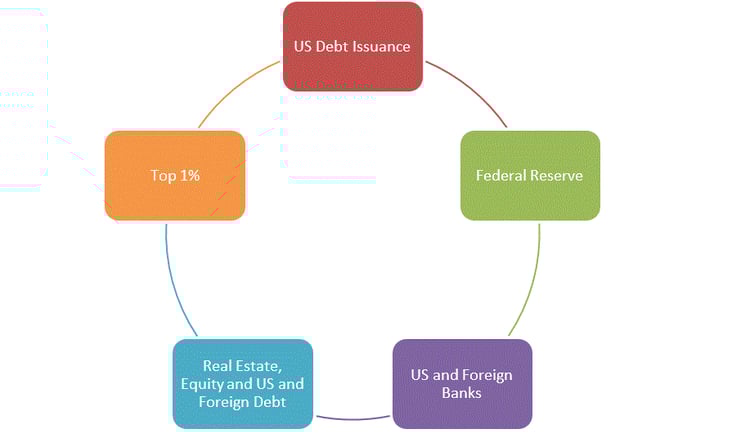
Ok so with all that said and with the SP500 firmly above its 2500 marker which will propel us another 100 ticks higher to 2600 in no time, let's get to the charts. Here is our chart with the trend channel we have been using all year long, the top comes in around 2533 this week: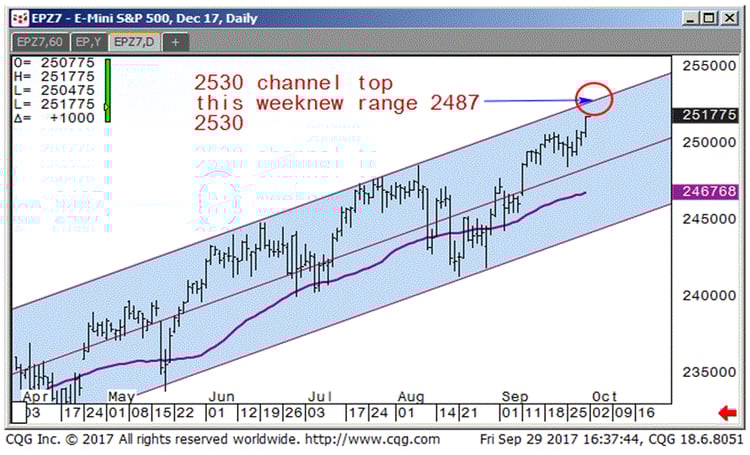
As for the tech heavy Nasdaq, we know 6000 is the key bull level so we will keep an eye on that: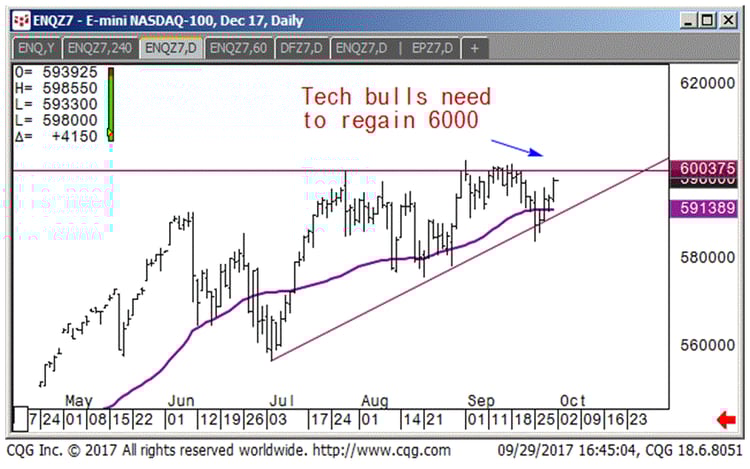
While we are on equities and we don't comment to often on individual equities, but CMG once again caught our eye. Chipotle has been testing its 61.8% retrace and we figure a weekly close below may spell doom this week, so keep an eye on this sour burrito: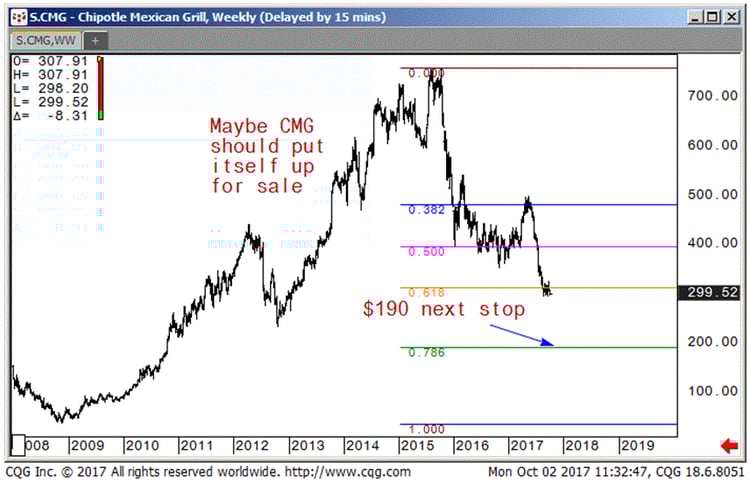
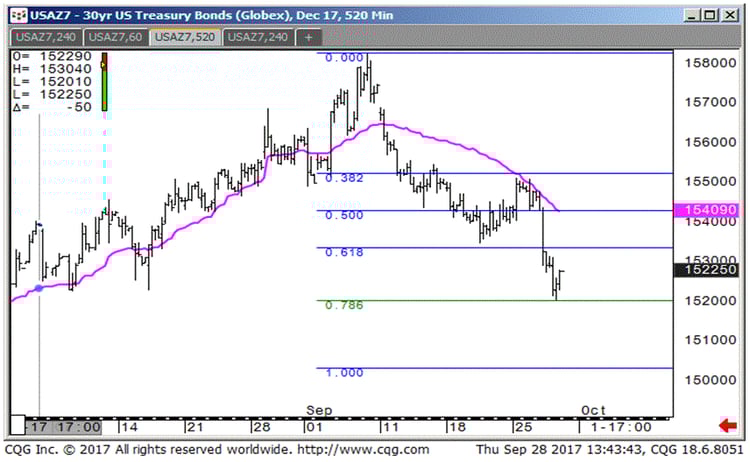
Moving over to the 30yr bond future we can see that 152-00 is highly significant and has held for now, this will become our key to any future movement, a rejection from here could spring the bond back into another up trend, a close below and this may see more pile into the higher rate theme:
As for the US 10yr Treasury yields they are back above their downtrend for the year and are sitting squarely on the 200 period MA.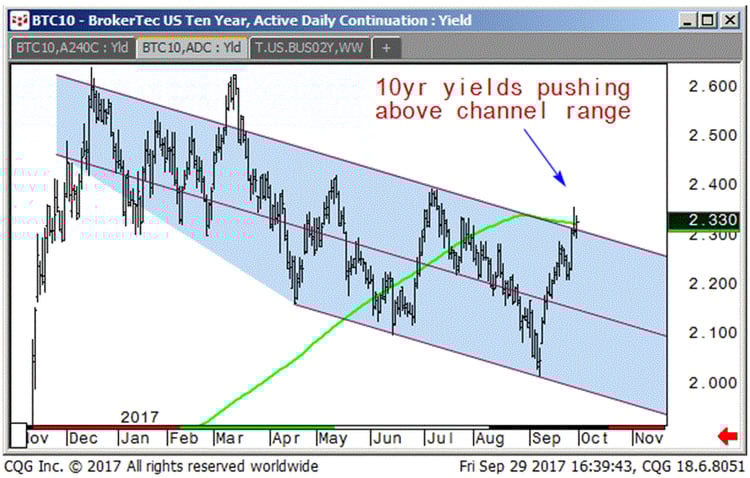
Finally moving to the Yen 8733 seems important and a test may be in the offing: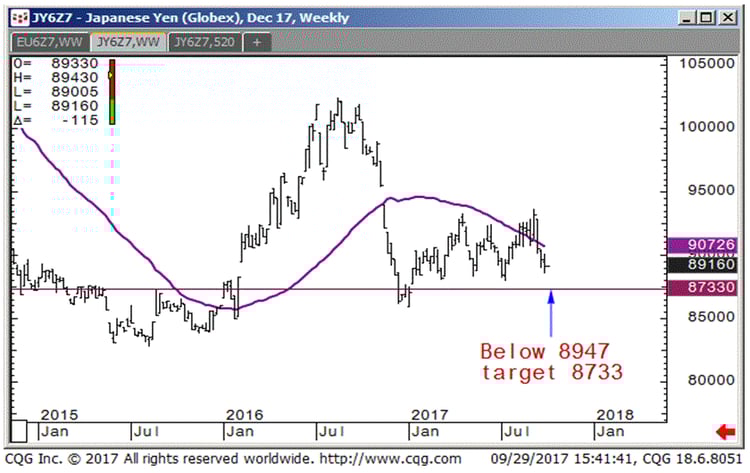
Ok that is it, we hope you learned a bit from this week's letter. As always feel free to drop us some comments, suggest some topics or ask a simple question. We love a collaborative effort and we feel that we can all learn from each other in some way or another. We don't want you to think we have a negative, cynical outlook on things, but rather we pride ourselves in knowing what's under the hood and it comes at an exhaustive , well researched, time long spent in order to give you a proper understanding of the facts the way we see them. We feel the price is in the pudding or is it proof…what we mean, is the price of any given asset is the only information we need in order to decipher and breakdown how exactly the markets have derived that price. We understand markets to exhibit chaos, yet we try to find form and function where others cannot. We aren't always correct in our thesis but we present you the reader with an in-depth look at markets the way professionals trade the market and that's our goal, well one of them at least! Ok the weekly settles are below, thanks for reading Cheers!
Finally, we will decidedly end our notes with our reaffirmation of the growing need for alternative strategies. We would like to think that our alternative view on markets is consistent with our preference for alternative risk and alpha driven strategies. Alternatives offer the investor a unique opportunity at non correlated returns and overall risk diversification. We believe combining traditional strategies with an alternative solution gives an investor a well-rounded approach to managing their long term portfolio. With the growing concentration of risk involved in passive index funds, with newly created artificial intelligence led investing and overall market illiquidity in times of market stress, alternatives can offset some of these risks.
It is our goal to keep you abreast of all the growing market risks as well as keep you aligned with potential alternative strategies to combat such risks. We hope you stay the course with us, ask more questions and become accustomed to looking at the markets from the same scope we do. Feel free to point out any inconsistencies, any questions that relate to the topics we talk about or even suggest certain markets that you may want more color upon.
__________________________________________________________________________________
Capital Trading Group, LLLP ("CTG") is an investment firm that believes safety and trust are the two most sought after attributes among investors and money managers alike. For over 30 years we have built our business and reputation in efforts to mitigate risk through diversification. We forge long-term relationships with both investors and money managers otherwise known as Commodity Trading Advisors (CTAs).
We are a firm with an important distinction: It is our belief that building strong relationships require more than offering a well-rounded set of investment vehicles; a first-hand understanding of the instruments and the organization behind those instruments is needed as well.
Futures trading is speculative and involves the potential loss of investment. Past results are not necessarily indicative of future results. Futures trading is not suitable for all investors.
Nell Sloane, Capital Trading Group, LLLP is not affiliated with nor do they endorse, sponsor, or recommend any product or service advertised herein, unless otherwise specifically noted.
This newsletter is published by Capital Trading Group, LLLP and Nell Sloane is the editor of this publication. The information contained herein was taken from financial information sources deemed to be reliable and accurate at the time it was published, but changes in the marketplace may cause this information to become out dated and obsolete. It should be noted that Capital Trading Group, LLLP nor Nell Sloane has verified the completeness of the information contained herein. Statements of opinion and recommendations, will be introduced as such, and generally reflect the judgment and opinions of Nell Sloane, these opinions may change at any time without written notice, and Capital Trading Group, LLLP assumes no duty or responsibility to update you regarding any changes. Market opinions contained herein are intended as general observations and are not intended as specific investment advice. Any references to products offered by Capital Trading Group, LLLP are not a solicitation for any investment. Readers are urged to contact your account representative for more information about the unique risks associated with futures trading and we encourage you to review all disclosures before making any decision to invest. This electronic newsletter does not constitute an offer of sales of any securities. Nell Sloane, Capital Trading Group, LLLP and their officers, directors, and/or employees may or may not have investments in markets or programs mentioned herein.