July 24, 2018
China Tries To Fight Tariffs
As we talked a few letters back about the prospect for protectionism and tariffs turning into currency wars, which then have a tendency to turn into hot wars, it is largely apparent this week things have certainly escalated. The PBOC has decided to fight Trump and his tariffs with a little bit of devaluation. Now we know the PBOC doesn’t have much leeway in this arena as they will risk two very important things,
- A continued capital flight out of the country
- Massive reserve loss from a decrease in accumulation due to lack of exports.
We need only go back to late 2015 to see this systemic loss of global growth via these trade wars. Remember in the zero-sum game of trade, you can’t be both a net exporter and importer and thus, the easiest game to play is devalue one’s currency. However, this is an absolute race to zero which will drag the global economies on a deflationary spiral. If China continues this path, it will certainly dampen the Federal Reserve’s hopes for its continued rate hiking path as this situation would most certainly cause them to pause or even change course as global growth sinks. If that isn’t enough of a worry, this headline from RT News might be, “China must speed up development of nukes to deter US aggression – state media. Cold War 2.0?
We aren’t sure how much room China has in terms of viable reserve accumulation, but we know one thing, the mountains of credit and debt it has created over the last decade is staggering. Will China be able to handle a slowdown without destroying their credit markets? We highly doubt it and this chart paints and obvious painful picture should things indeed take a turn for the worst:
China isn’t alone in this massive debt and credit push as this next chart exhibits nicely: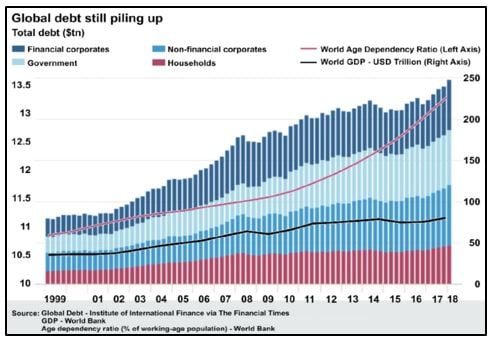
The prior charts should make it quite obvious that the key to nominal price appreciation is indeed credit growth, without it, well, we probably will never know! WE also had the pleasure this week to speak with a CEO of a multinational industrial parts supplier and he gave us his opinion on the effects of tariffs. He said that the uncertainty that is being created upon future growth is strictly conveyed in the apprehension for CAPEX spending and second, he told us that the rise in input costs across all channels isn’t helping margins as the ability for customers to absorb these extra costs is diminutive. We couldn’t agree more but we feel this is just the beginning, unfortunately.
Moving along, we know the FED has the tools to control the short rate but the long rate is susceptible to variable market forces. We also must note the risk that the FED may be influenced by another central banks action, in particular the BOJ may decide to allow its 10yr JGB rate a wider trading band. If this does indeed seem to be the case, expect long dated US yields to rise and the curve to dramatically steepen, just in time to catch a lot of flatter curve players off sides. In fact, here is a US 2y10y chart from today out of Zhedge:
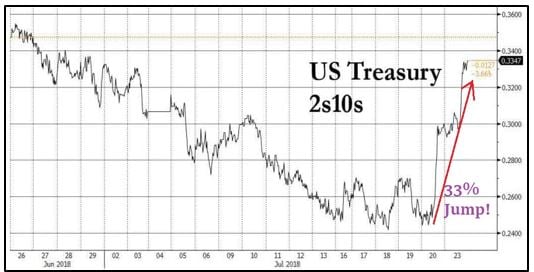
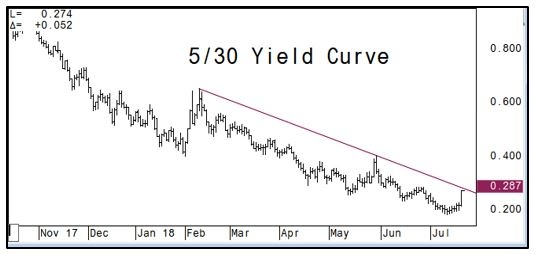
Certainly not the move one is positioned for in a rate hiking environment, #Pain. Here is another chart, this time of the US 5y30y curve from last Friday, which saw this yield curve differential jump 23%:
Here are a couple more charts which we believe capture the essence of a global protectionist measure, Lumber and Copper:
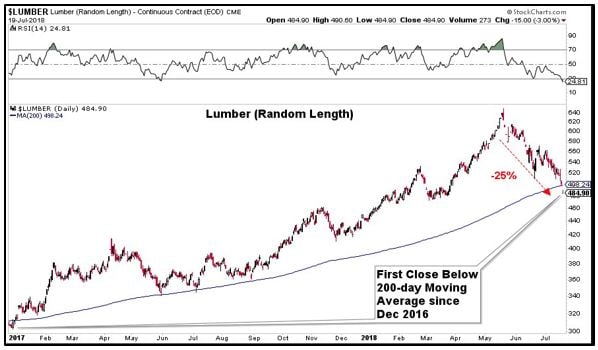
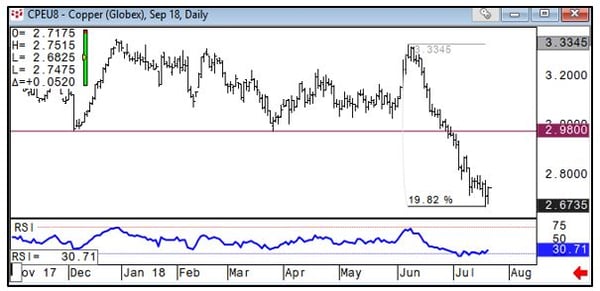
Copper did rebound a bit on Friday, but you get the picture!
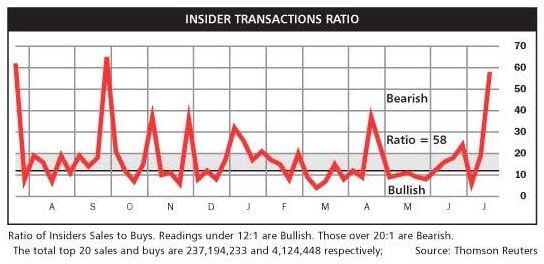
Moving over the equity land, Google was fined $5 billion by the EU under antitrust provisions. (WSJ) We also saw a WSJ report on analysis from Robert J. Jackson Jr. a commissioner at the SEC regarding C-suite insiders capitalizing on their equity buyback plans. “The SEC gives an exemption from market-manipulation rules to companies doing a buyback,” Mr. Jackson said in an interview. “The SEC shouldn’t be making it easier for executives to use them to cash out.” Mr. Jackson, a former law professor, examined stock trades at 385 companies that announced buybacks in 2017 through this year’s first quarter. He found the percentage of insiders selling shares more than doubled immediately following their companies’ buyback announcements as many of the stocks popped. (WSJ) Dare we ask who Mr. Jackson thinks the SEC actually works for?
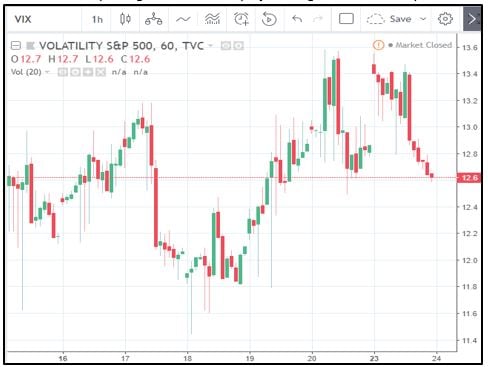
WSJ reporting that the US Equity trading volumes have plummeted this month, falling to their lowest levels this year on Friday. The S&P500 hasn’t had a 1% move up or down this entire month, let’s chalk it up to vacationers shall we. The S&P 500 Volatility Index continues to fall as the market rebounds from the tariff and currency wars.
Also buoying the markets were earnings out of Microsoft which rose to $108 an all-time high on Friday on revenues of $30.1 billion. Today, Alphabet reported $3.2 billion in net income last quarter even after accounting for the mega EU fine. Shares as of this writing were trading as high as $1250 pushing it ever closer to the $900 billion market cap. However not to dampen all the good news, this chart from Reuters sends a different connotation of the breadth in equity prices rising:
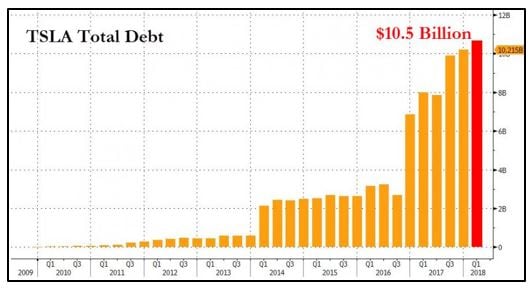
Not that Tesla needs any more negative coverage, it was reported this week that they hit up a few suppliers to “refund a portion of what the electric car company has spent previously.” We aren’t even sure how the accounting for that would go, but we are sure that this wreaks of a liquidity crunch. With this chart of Tesla’s total debt, we can see why Unicorn Musk is so worried, although we think it’s the bond holder that should be worried:
Moving now to the equity technical futures charts courtesy of Keystone Charts Inc, first up the SP500 future which continues to magnet the 2814 level and a level that needs a decisive close above to get bulls back reengaged for that next push higher:
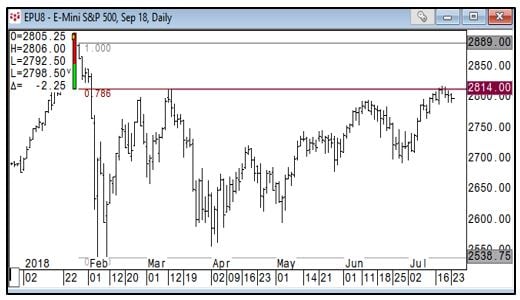
As far as the SPX, its trading slightly above its resistance level and has tilted in the bull’s favor, for now, but a close back below negates this move:
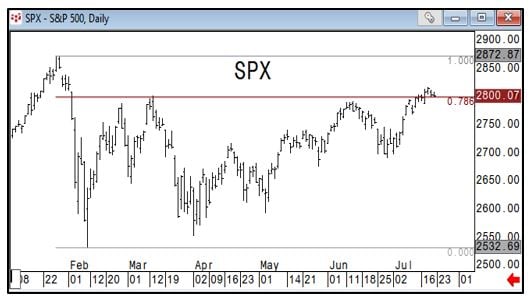
The NASDAQ future has been the equity stand out, but perhaps we have seen some sector rotation hitting this market, anyhow 7323 is important magnet here:
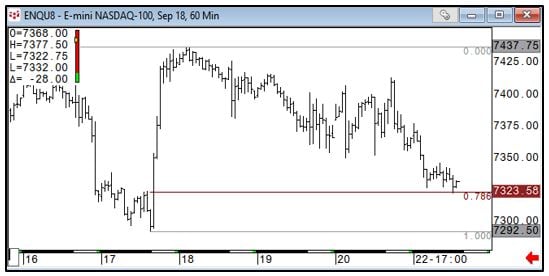
For all of you risk parity folks, the NQES is at a crux:
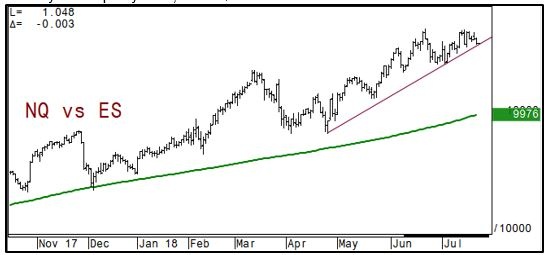
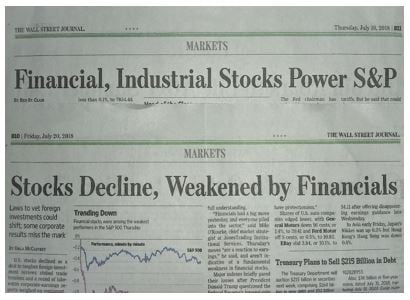
Just to reiterate why we love an alternative long short strategy for investing, because every excuse can be made for why things go up and why they fall. Just to give an example here are the WSJ headlines for Thursday and Friday last week:
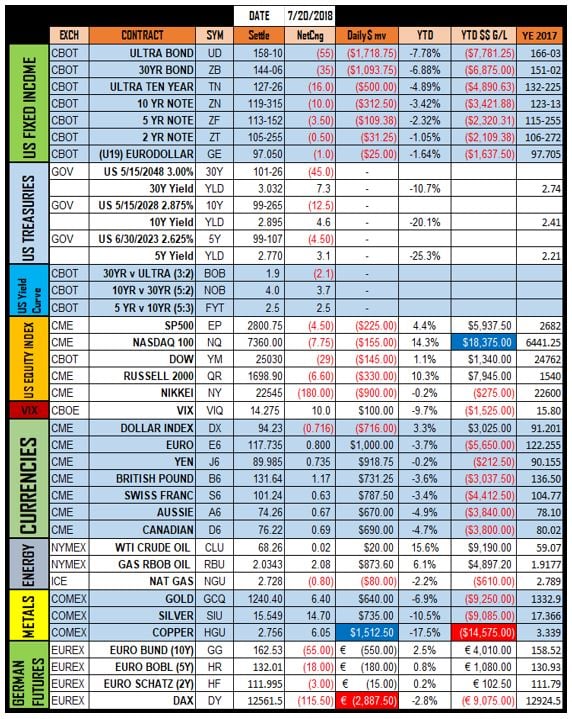
Here are our futures settlement sheet from Friday July 20th 2018:
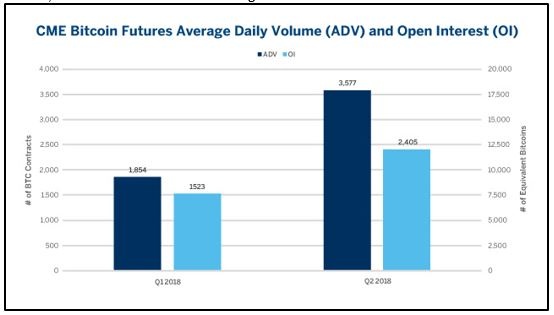
Let’s move to Crypto where Bitcoin continues to power higher, most likely catching a bunch of future players naked short ducking to cover. Speaking of futures, the CME Group posted their latest Q2 numbers, here are the highlights:
- ADV reached 3,577 contracts, +93% versus Q1; equal to ~$140M notional or 17,885 equivalent bitcoins
- OI, up every month since December, surpasses 2,400 contracts, +58% versus Q1
- Bid-ask spread has continued to tighten since March, narrowing from 10 ticks to under 2 ticks
- Over 1,500 active accounts are trading
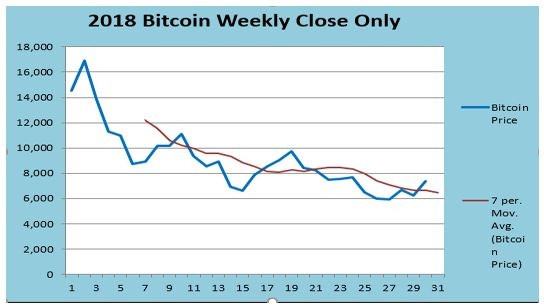
The weekly Bitcoin chart posted a nice close above our simple 7 period moving average, shown here, utilizing weekly close only:
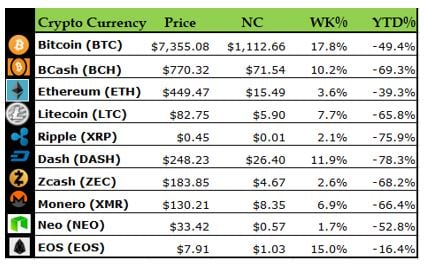
Here are the weekly crypto settles for Friday July 20th 2018:
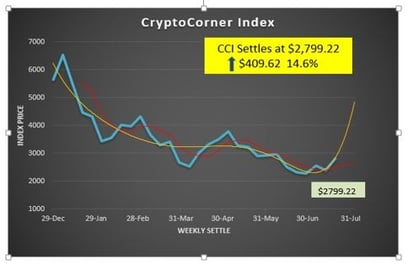
When we look at our CC Index we can see that the index had a nice week up 14.6%, settling the week at $2799.22 up $409.62. This week move puts it solidly above the weekly closing trendline and may spell more trouble for any naked future short sellers. We really haven’t seen the futures sellers resolve since they came into being, but this move may be just the beginning if indeed complacent sellers are running rampant. Considering the growth of BTC trading at the CME, this should be interesting.
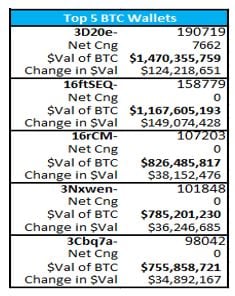
We also noted some new large entrants in the BTC complex on the Bitcoin Richlist.
- 10885 BTC valued at $80 million
- 14837 BTC valued at $113 million
- 48500 BTC valued at $371 million
- A chunky 85947 BTC valued at $659 million
So, it’s fair to say, some heavy hitters have stepped in and put their foot in the sand! As far as the top 5 wallets, they are still the same:
Ok, that does it, sorry for the long letter, but there was a lot to cover this week, actually too much for a strange July that is seeing a cooler Midwest, a dryer southwest and wetter Eastern seaboard! We suppose like the markets, a little something for everyone! So, keep your senses sharp and your mind open, for we never know when opportunity may strike, usually and more often than not, when we least expect it too. Congrats to Francesco Molinari the first Italian to ever win a major, winning the 2018 British Open at the R & A GC in Carnoustie Scotland. As a side note Tiger finished in the top ten for the first time in over 5 years, cheers!
Capital Trading Group, LLLP ("CTG") is an investment firm that believes safety and trust are the two most sought after attributes among investors and money managers alike. For over 30 years we have built our business and reputation in efforts to mitigate risk through diversification. We forge long-term relationships with both investors and money managers otherwise known as Commodity Trading Advisors (CTAs).
We are a firm with an important distinction: It is our belief that building strong relationships require more than offering a well-rounded set of investment vehicles; a first-hand understanding of the instruments and the organization behind those instruments is needed as well.
Futures trading is speculative and involves the potential loss of investment. Past results are not necessarily indicative of future results. Futures trading is not suitable for all investors.
Nell Sloane, Capital Trading Group, LLLP is not affiliated with nor do they endorse, sponsor, or recommend any product or service advertised herein, unless otherwise specifically noted.
This newsletter is published by Capital Trading Group, LLLP and Nell Sloane is the editor of this publication. The information contained herein was taken from financial information sources deemed to be reliable and accurate at the time it was published, but changes in the marketplace may cause this information to become out dated and obsolete. It should be noted that Capital Trading Group, LLLP nor Nell Sloane has verified the completeness of the information contained herein. Statements of opinion and recommendations, will be introduced as such, and generally reflect the judgment and opinions of Nell Sloane, these opinions may change at any time without written notice, and Capital Trading Group, LLLP assumes no duty or responsibility to update you regarding any changes. Market opinions contained herein are intended as general observations and are not intended as specific investment advice. Any references to products offered by Capital Trading Group, LLLP are not a solicitation for any investment. Readers are urged to contact your account representative for more information about the unique risks associated with futures trading and we encourage you to review all disclosures before making any decision to invest. This electronic newsletter does not constitute an offer of sales of any securities. Nell Sloane, Capital Trading Group, LLLP and their officers, directors, and/or employees may or may not have investments in markets or programs mentioned herein.
