August 8, 2018
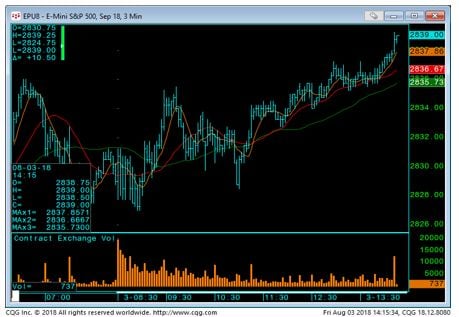
On Friday we saw the equity markets first head fake only to be driven higher after NFP printed 157k and unemployment fell 0.1 to 3.9%. In the morning, the SP500 saw initial buying then fell back to 2828 support and then never really looked back, here is the chart from Friday August 3rd:
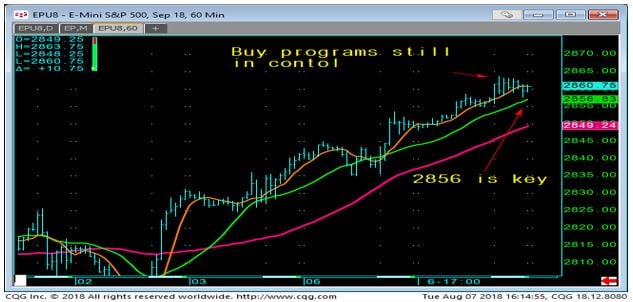
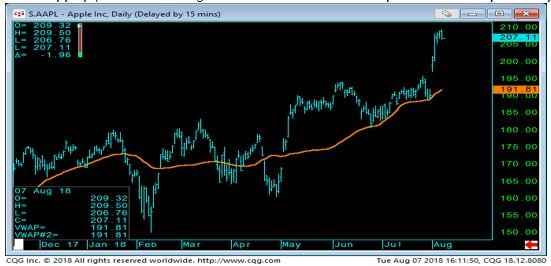
Of course, the day prior was all #Apple as their stock rose 3% pushing it finally above the all-important $207 level and more importantly over the $1 Trillion market valuation level. We will get to Apple after we cover a few more charts. When we look at the SP500 today we can see this obvious buy program continuation, we certainly think 2856 is key for the bulls here:
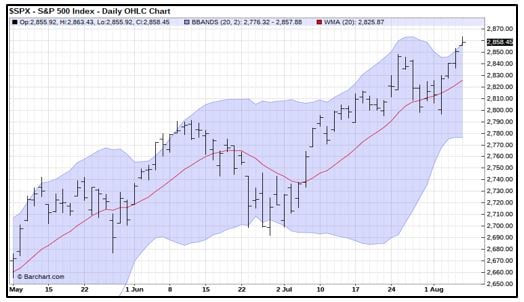
Moving along we can see that the SPX continues to defy gravity and is now firmly entrenched and longer-term bulls can continue to breathe a sigh of relief as the market is well above the 2830 level for now:
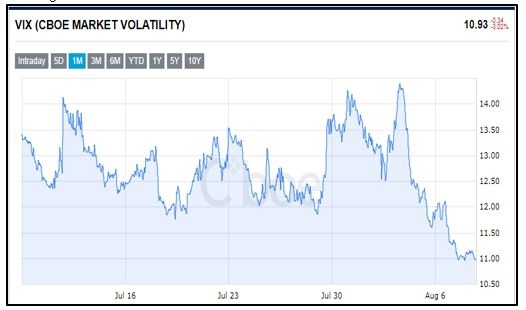
The VIX continues to sink (obviously), falling once again below 11, but we are cautiously awaiting a pop in the VIX complex as the market is driven higher, indicating to us the SKEW is being reluctantly driven in a mass reach for fear of missing out. This happened on the way up to the January highs and we no doubt feel the linear algo based buy programs will be enticed once again!
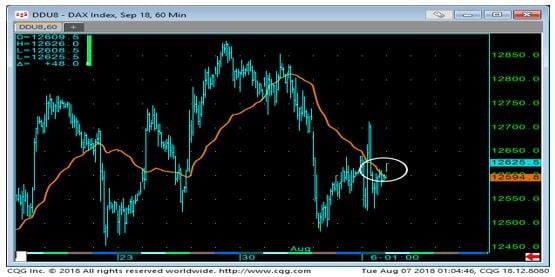
Monday night saw the European markets being led by an obvious program in the DAX, this is for all you scalpers out there. We will note 3 successive charts:
- The initial breakout
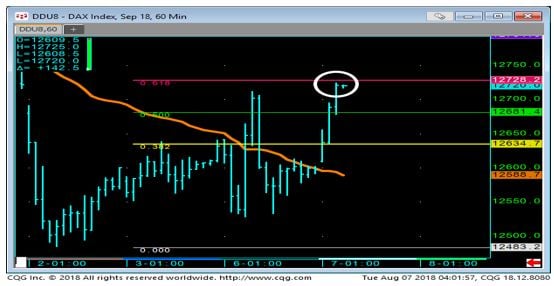
- The follow through with the 61.8 fib stopping it dead in its tracks
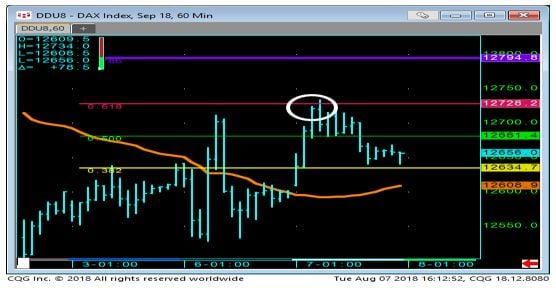
- The fall back to support 38.2 fib support
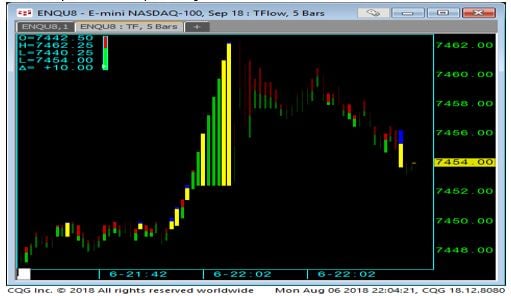
All in all, the equity markets looked bullish even the Nasdaq saw some quick chunky buying in the European session, lending further credence to the continued bull case:
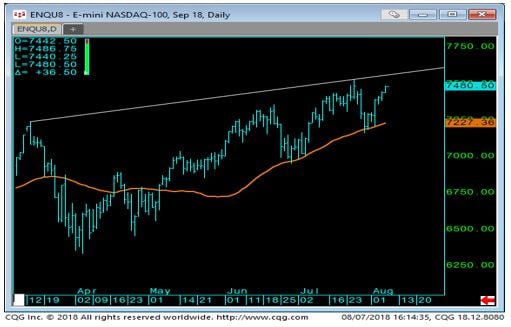
As far as today’s Nasdaq action it’s on its way to the upper trendline with clear VWAP support at 7227:
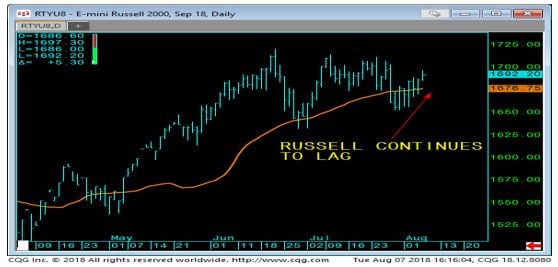
We know value has lagged lately, but it too seems to be picking up some residual steam here, this next chart is the Russell 2k Index future:
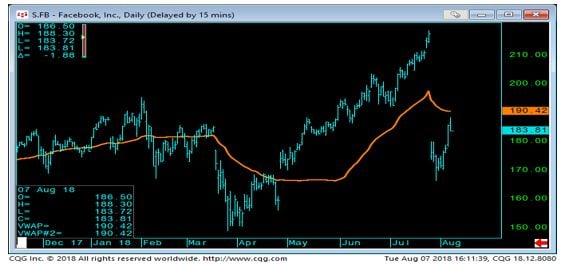
Moving over to a few of the more notable individual equity charts, Facebook stalls below the VWAP here:
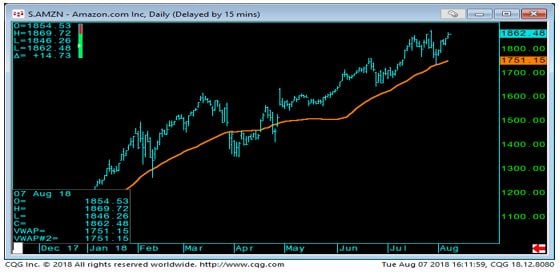
Amazon continues to climb:
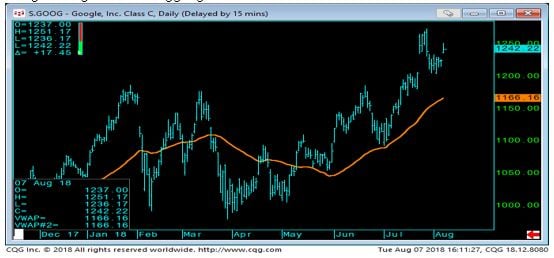
Google is higher but struggling:
As for Apple, $207 should magnet for some time here and profit takers may show up:
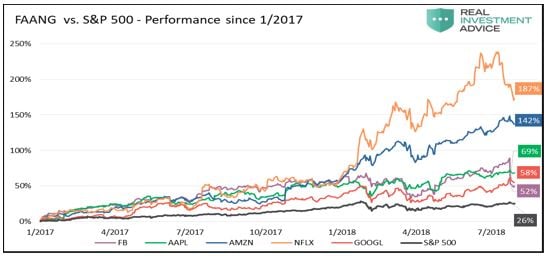
As far as looking at overall performance of the FANGs vs the EminiSP500, here is a great chart from Real Investment Advice:
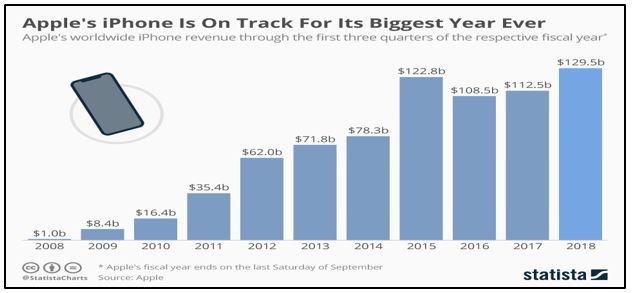
As far as a few more words about Apple, we know ole man Buffett is happy, his Berkshire is the second largest holder with a 5% stake. Investing nearly $30 billion over the course of 2 years from 2016-18 according to the WSJ. Here are just a few more charts related to Apple:
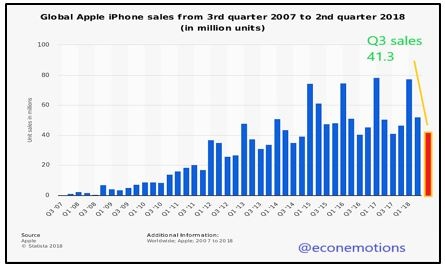
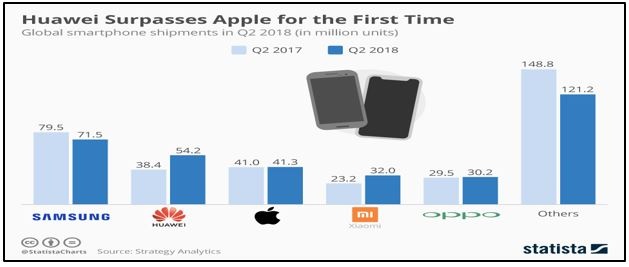
Statista had a great chart to put the global smartphone market into context:
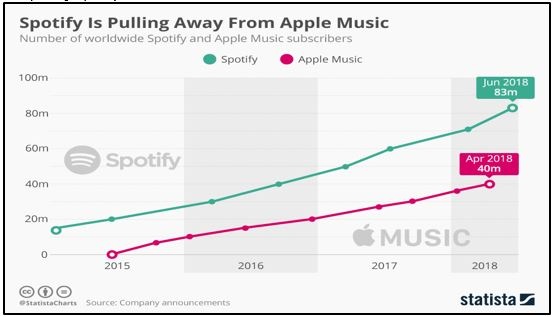
As far as Itunes alleged digital music dominance, well Statista also has this juicy chart comparing Spotify:
We know these equity markets are resilient, death defying, but what does it all say about the real driver of nominal asset prices. In plain English, what does it say about the Federal Reserve and how they execute their mandates? The Fed left rates alone last week in an obvious, trader lite August session, but this following chart made us smirk a bit and we annotated the chart to express our opinion. Yardeni research puts out some good stuff you should check them out, our annotation is obvious:
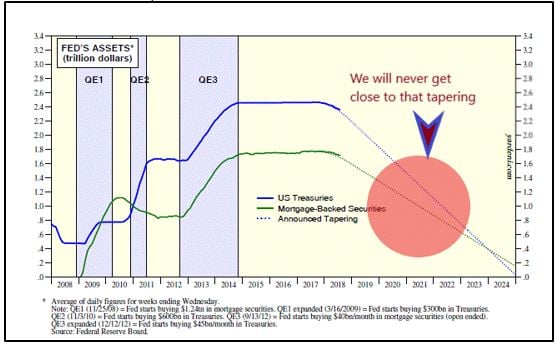 Does any investor truly feel that the FED can actually taper per this indicative slope? We sure don’t but it makes for a good visual. The monetary largesse does have some obvious upsides, like upbeat and ever constant earnings growth, such as this quarter’s 23.5% quarterly profit growth some 2.5x revenue growth over the same period. (Reuters) Locally Ace Hardware is doing their job, the Oak Brook IL based company has opened 87 new stores, creating some 1300 new jobs, with the firm expecting to open 160 total new stores this year. (WSJ) Also it shouldn’t be a surprise as to what sector led this quarter, considering the huge jump in oil this year SP500 Q2 earnings growth in the sector was up a staggering 124.9% yoy (WSJ)
With all this equity land euphoria, Fidelity felt it was time to add a little bit of deflation to the industry. In economics when an industry has a general understanding, perhaps even if it’s just a tacit one, when one of its members falls out of line, it can set off a chain of rapid matching cost cutting events. Now we don’t disagree with their motives, but this is surely a symptom of central banks QE and subsequent no pull back market linear growth structure. This practice of no fee funds would be impossible in a volatile market, but an obvious possibility in one that simply rises in perpetuity. What this tells us is that complacency has certainly reached a crescendo and this markets run is well, long overdue by nearly all metrics. We wish them luck and await the TD Ameritrade, Schwab response to these cost cutting measures.
In other news the DOJ continues to press the AT&T-Time Warner merger in the appeals courts. We applaud their efforts as monopolistic practices are predatory in nature, well at least one can argue they are, but economic supply/demand curves can easily postulate this position, price setter or price taker, we know the truth, so we wish the DOJ luck. As consolidation runs rampant, we figure that department will see some growth in the years ahead! Amazon anyone…just sayin…
As for the rest of this week, well the US bond market is swallowing a hefty supply of debt. This week alone will see some $174 billion in new debt, with the big 10yr and 30yr auctions Wednesday and Thursday. Set ups and concessions have begun, and we should see higher coupons from the May issues, we are potentially looking at possible 3.0% and 3.125% coupon rates respectively. Which would put them about an 1/8 or 12.5 basis points higher than May coupons. The U.S. Treasury will borrow some $329 billion this quarter up 21% from their estimates earlier this year and with another expected $440 billion in the final quarter that puts the total upward of $1.33 Trillion for the entire year! Now add an estimated $833 billion federal budget deficit and well, you get a better picture of the Federal Reserves “rock and hard place.” As 10yr duration equivalent aggregate treasury future net spec shorts continues to grow, we can only suspect once Thursday’s auction is over, they better hope for a decent tail, or else we suspect yields will crater. Speaking of yields in the US 30yr let’s have a look shall we:
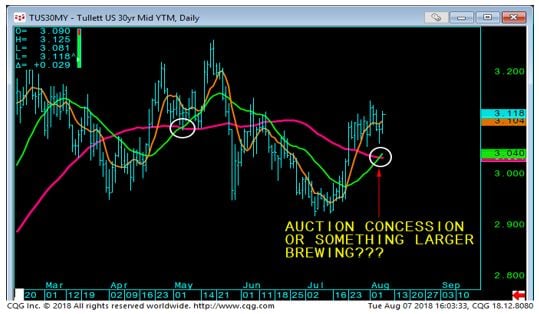
The moving averages are setting up for a continued rise in yields, although we smell a rat here and will need further confirmation above 3.13 to really get an opinion. A fail back below 3.04 and rest assure the long end shorts will be running with their tails between their legs!
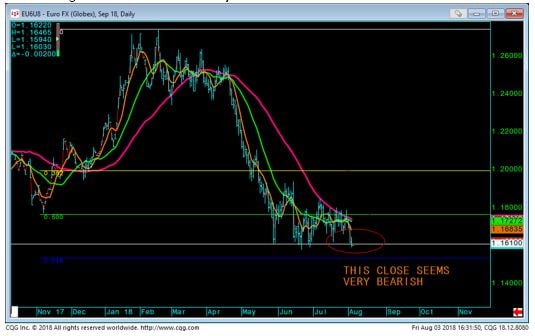
Ok, our final chart is of the Euro Currency future, this is a peculiar set up this 116.10 level is super key and could lead to a complete drubbing, but it will have to happen soon, if not, continuation along this horizontal box may be in order:
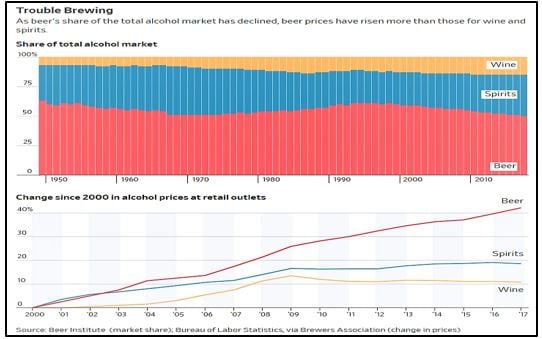
We have been reading a lot about the beer industry lately, all the consolidation, all the microbrews, the ever-changing consumer demand, which for the first time according to the Beer Institute (yes there is such a thing) drinkers chose beer just 49.7% of the time last year down from 60.8% in the mid-90s, with the millennials posting an even greater decline. The consolidation, the vertical and horizonal integration has been massive, we remember the AB InBev struggle to acquire then Grupo Modelo, who was kicking their butts with Corona. The $20 billion merger was under fire from the DOJ, but concessions were made and in what was to be nothing more than sleight of hand as InBev was required to give Constellation Brands US brand rights, but it owned the breweries. Anyway, we can’t help but think the rise in beer prices isn’t going to make up for their lost margins as consumers simply will not pay and will go right to the substitutes of wine and liquor. Here is a nice chart and you can see, their prices will have to fall, the pricing power is over in our opinion:
Ok that does it, we are thirsty now, so we must end this note, but here’s a bit of knowledge before we go and since we are on the Corona topic, do you know why they serve them with a lime? It was originally used not as a flavor enhancer, but to keep the flies out! So now you can impress your next bar mate, just make sure you credit the source as we always strive to keep you running, well ahead of the (6) pack, Cheers!
Capital Trading Group, LLLP ("CTG") is an investment firm that believes safety and trust are the two most sought after attributes among investors and money managers alike. For over 30 years we have built our business and reputation in efforts to mitigate risk through diversification. We forge long-term relationships with both investors and money managers otherwise known as Commodity Trading Advisors (CTAs).
We are a firm with an important distinction: It is our belief that building strong relationships require more than offering a well-rounded set of investment vehicles; a first-hand understanding of the instruments and the organization behind those instruments is needed as well.
Futures trading is speculative and involves the potential loss of investment. Past results are not necessarily indicative of future results. Futures trading is not suitable for all investors.
Nell Sloane, Capital Trading Group, LLLP is not affiliated with nor do they endorse, sponsor, or recommend any product or service advertised herein, unless otherwise specifically noted.
This newsletter is published by Capital Trading Group, LLLP and Nell Sloane is the editor of this publication. The information contained herein was taken from financial information sources deemed to be reliable and accurate at the time it was published, but changes in the marketplace may cause this information to become out dated and obsolete. It should be noted that Capital Trading Group, LLLP nor Nell Sloane has verified the completeness of the information contained herein. Statements of opinion and recommendations, will be introduced as such, and generally reflect the judgment and opinions of Nell Sloane, these opinions may change at any time without written notice, and Capital Trading Group, LLLP assumes no duty or responsibility to update you regarding any changes. Market opinions contained herein are intended as general observations and are not intended as specific investment advice. Any references to products offered by Capital Trading Group, LLLP are not a solicitation for any investment. Readers are urged to contact your account representative for more information about the unique risks associated with futures trading and we encourage you to review all disclosures before making any decision to invest. This electronic newsletter does not constitute an offer of sales of any securities. Nell Sloane, Capital Trading Group, LLLP and their officers, directors, and/or employees may or may not have investments in markets or programs mentioned herein.