November 29, 2021
The final piece that complements market structure.
By Andrew Hecht
- The last in the series- We looked at the other components of market structure
- Fundamentals versus technicals
- The wisdom of the crowd
- Trend following indicators establish support and resistance levels
- The trend is your greatest friend in markets- Prices tend to rise or fall to unforeseen levels that defy logic
I follow a technomental analytic approach to the commodities markets in a quest to determine the path of least resistance of prices. Each piece of a market’s structure provides a clue. When assembled, a picture tends to emerge, increasing the odds of success for long or short positions.
Market structure deals with each commodity’s supply and demand fundamentals. Each market has idiosyncratic characteristics as production locations are in areas where the earth’s crust is rich in reserves or the climate supports crop growth. Consumption is ubiquitous as people worldwide depend on raw materials to power their lives, provide shelter and nutrition. Fundamentals are a substantial part of the analytical equation, but crowd behavior is equally important. The saying, “the trend is your friend,” is critical as when buyers are more aggressive, prices rise, and when sellers dominate, they decline.
Therefore, technical analysis is a crucial tool that enhances the clarity of a picture created by the various market structure pieces.
The last in the series- We looked at the other components of market structure
In past articles, we looked at how term structure or the price differentials between delivery periods can offer clues about the supply and demand equation in commodity markets. We examined processing, quality, location, and substitution spreads which provide more insight into the path of least resistance of prices.
The market structure components are puzzle pieces dealing with fundamentals. Many variables can push commodity prices higher or lower. The spreads and differentials that determine the overall market structure are a microeconomic approach to analysis. While they provide critical information, it is incomplete without taking the technical state of a market into account. Market structure deals with endogenous factors on the microeconomic side. Technical analysis tends to incorporate the market’s interpretation of macroeconomic factors.
Fundamentals versus technicals
Fundamental and technical analysis are not mutually exclusive; they can be complementary. In commodity markets, as in all markets, there are cycles. Understanding the history of cyclical behavior can help predict the future. Fortunately, you do not have to pour over thousands of pages of prices and data. All the data required for technical analysis are contained in one picture—a price chart.
Fundamental analysis examines numerous aspects of an individual commodity market, while technical analysis studies past and current price action in futures contracts.
The wisdom of the crowd
In his 2004 book, The Wisdom of Crowds, author James Surowiecki explained “why the many are smarter than the few and how collective wisdom shapes business, economies, societies and nations” through a series of case studies. The book applies to the commodity markets as a price chart is a track record of collective wisdom.
Prices move higher when buyers are more aggressive than sellers. They fall when sellers dominate buyers.
Trend following indicators establish support and resistance levels
Many technical indicators and price patterns reflect the crowd’s wisdom. Support levels are below the current price. They are levels where technical analysts believe that buyers will outnumber sellers. Resistance levels are above the current price. They are levels where technicians believe sellers will outnumber buyers. These beliefs often lead to a self-fulfilling prophecy as technical analysts sell near resistance and buy near support.
Bullish or bearish trends do not last forever as markets rarely move in straight lines. Short-term traders watch very short-term, often intraday, charts. Longer-term technical traders and investors watch daily, weekly, monthly, or longer-term charts.
Price momentum and trend strength are two critical components of technical analysis. A stochastic oscillator quantifies the momentum of a price rise or decline. They compare closing prices for a stated period with price ranges over time. The theory behind stochastics is prices tend to close near the highs in rising markets and the lows in falling markets. A reading below 20 indicates an oversold condition, while a reading above 80 points to an overbought condition.
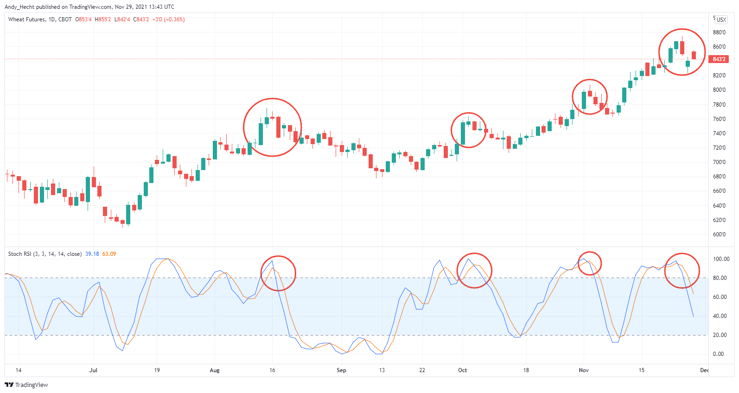 Source: TradingView
The daily CBOT wheat chart shows that overbought conditions lead to price corrections while oversold conditions lead to rallies. However, a market can remain in overbought or oversold territory for extended periods. When the stochastic reaches an overbought or oversold condition, the price action tends to run out of upside or downside steam, leading to a reversal.
The relative strength indicator compares recent gains and losses in a market to establish overbought or oversold conditions. An RSI below 30 indicates an oversold condition, while a reading over the 70 level indicates that a market is in overbought territory.
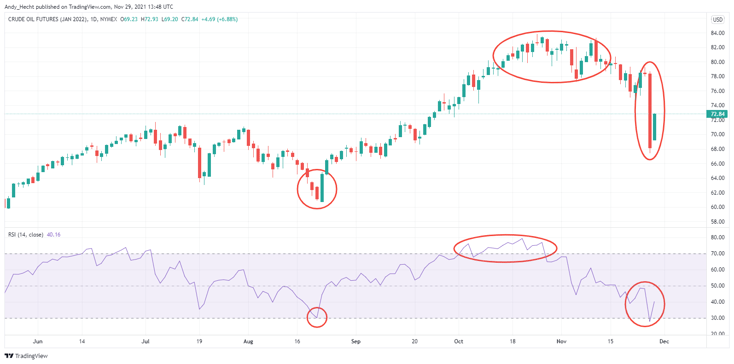 Source: TradingView
The daily chart of NYMEX crude oil futures shows the decline in the RSI to below 30 in late August 2021 led to a reversal and price rally. While the indicator remained above the 70 level from late September through late October, it eventually ran out of upside steam, leading to a price correction in November. On November 26, 2021, crude oil experienced the most significant decline since April 2020. The RSI fell to an oversold condition. We will find out over the coming days and weeks if the decline leads to a bottom with the technical metric in oversold territory.
These technical indicators reflect price action only. They ignore all of the noise that can lead to emotional impulses. Technicians use stochastics, Bollinger bands (which highlight support and resistance levels), RSI, and many other technical tools, for any time frame ranging from minute-to-minute to very long-term horizons.
Technical analysis is far from perfect, but it adds another dimension and creates another puzzle piece for determining the path of least resistance for prices in markets across all asset classes.
The trend is your greatest friend in markets- Prices tend to rise or fall to unforeseen levels that defy logic
The old saying that “the trend is your friend” reflects an acceptance that crowds make better decisions than individuals. Trends are an integral part of investing and trading calculus. Ignore trends at your peril as going against conventional wisdom is one of the leading causes of losses. Markets often move to extremes and remain irrational for far longer than most market participants can stay solvent. Commodities are highly volatile assets. Price variance can lead to wild swings to highs and lows. In April 2020, crude oil fell to negative $40.32 per barrel in a bearish frenzy. In May 2021, lumber futures rose to over $1700 per 1,000 board feet as bullish price action pushed the price to an irrational and unsustainable level. However, crude oil at zero was illogical, as was lumber at $1,000. Market participants that did not respect the trend suffered financial distress.
Trends often carry prices to price levels on the up or downside that defy logic, reason, and rational analysis. Following and respecting trends often saves a trader or investor from catastrophic losses. We never attempt to pick a top or bottom in any market because we respect the crowd’s wisdom. However, when the trend bends, we adjust our risk positions accordingly.
Finally, discipline is what defines success in markets. Remember, a professional baseball player needs a 0.300 batting average to make it into the Hall of Fame. That average means they make an out two out of every three trips to the plate. Trading and investing are similar. Many of the most successful traders call the market wrong more than half the time. However, those that approach markets with a risk-reward plan and stick to it improve their chances of success. Following trends allows profits to run. It also is self-correcting as it causes a market participant to reevaluate and close losing risk positions, before they cause severe financial damage.
One of the leading causes of losses is allowing a short-term trade to become a long-term investment because the price moves contrary to a forecast. Trend following is a tool that helps to correct as it validates or refutes an original thesis.
Respecting the crowd’s wisdom is an integral part of traders and investing and goes hand in hand with the puzzle pieces of a market’s structure.
Trading advice given in this communication, if any, is based on information taken from trades and statistical services and other sources that we believe are reliable. The author does not guarantee that such information is accurate or complete and it should not be relied upon as such. Trading advice reflects the author’s good faith judgment at a specific time and is subject to change without notice. There is no guarantee that the advice the author provides will result in profitable trades. There is risk of loss in all futures and options trading. Any investment involves substantial risks, including, but not limited to, pricing volatility, inadequate liquidity, and the potential complete loss of principal. This article does not in any way constitute an offer or solicitation of an offer to buy or sell any investment, security, or commodity discussed herein, or any security in any jurisdiction in which such an offer would be unlawful under the securities laws of such jurisdiction.