August 29, 2018
Last week we talked about the WSJ article called the Jocks vs the Nerds, the article discussed the migration of trading and financial markets from open outcry big boy fraternity clubs and Rolex wielding, heavy cell phone Wall Street traders toward a geekier quant PHD programming algorithmic style of today. The illustration that came with the article was great, credit Scott Anderson with a masterful piece, with a Gordon Gekko banker shirt and suspenders topped off with a heavy Motorola first edition battery phone to a blue tooth, Ipad, zipper vest wearing programmer trying to look cool. It was a fantastic rendition indeed!
Zhedg posted an article entitled, “Why do people assign value to paper money” by Frank Shostak via the Mises Institute. He talks about the circularity of the supply/demand for money and the purchasing power of money and that the primary acceptance of money is the result of “government decree.” What a powerful tool, don’t you think, to have the power to say this holds value and this doesn’t. He went on to focus upon Carl Menger who doubted that the origin of money is a government proclamation, which is further backed up by Mises regression theorem, which is outlined in this statement here,
“By regressing through time, we will eventually arrive at a point in time when money was just an ordinary commodity. Its price was set by the demand and supply for a commodity. The commodity had an exchange value in terms of other commodities, i.e., its exchange value was established in barter.
Frank further explained, “On the day a commodity becomes money it already has an established purchasing power or price in terms of other goods. This purchasing power enables us to establish the demand for this commodity as money. This in turn, for a given supply, sets its purchasing power on the day this commodity starts to function as money.”
A good article to read and one which we suggest you certainly do so. When an institution has such control that it has the power to issue currency and give it to whomever it chooses, this places an absolute inequality maxim upon those involved. What do we mean? We mean that winners and losers can be chosen, not at random, but by decree. Plainly put, the money printers
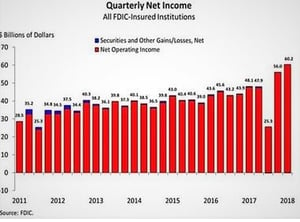
decide who is first to the monetary spigot. We need not look any further than this next Zhedge article aptly entitled, “U.S. Bank Profits Hit A Record $60 Billion In Q2” Do you honestly think this chart would look like this if the global central banks didn’t expand their balance sheets by a factor of 5 and peg real rates negative?
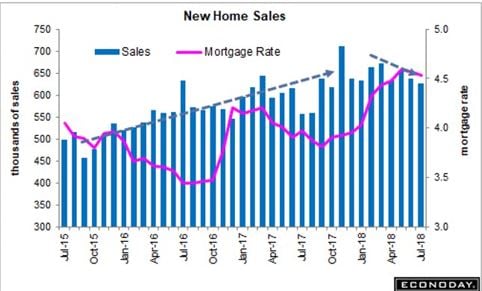
We visited MishTalk one of our favorite bloggers and he posted the new home sales chart which has sunk some 1.7%
This shouldn’t come as a surprise considering the Fed’s attempt to normalize short term interest rates:
Given this last chart we thought we would throw in a couple more home valuation examples from our own home town. We have been critical of housing lately as affordability is way down and we often like to point out extreme examples of valuation. For a mere $100k difference in price which one would you buy or expect to hold more value over time?

By the way this is a real-life example and both homes are currently for sale for those prices listed. Not to drive home the importance of value and time when it comes to investing, but the big Tudor is for sale at the same price it was bought for in 1988!
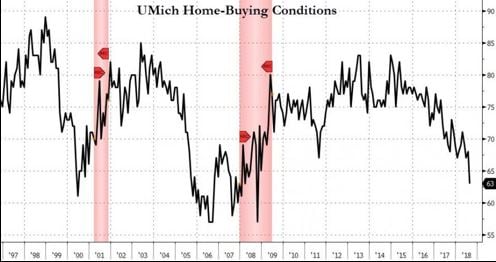
The buying conditions are moving south quickly and here is an up to dated UMich Home Buying Conditions chart:
Valuations aren’t subjective, rather they are a function of well researched and well documented quantitative analysis, well at least they should be. Outside a massive technological shift or paradigm shifting revolution, one should be able to quantify value in terms of being overpriced or underpriced. Now our global central banks have done their best to lure the investing public into thinking prosperity comes in the form of more debt and low rates. In fact, we would say their dual mandate is no longer price stability and stable employment, but rather perpetual Quantitative Easing and Negative real long-term rates. The true fact is, value isn’t subjective, rather a function of too much credit/money chasing a finite group of investments. Now if you talk to the large concentrated wealth investors 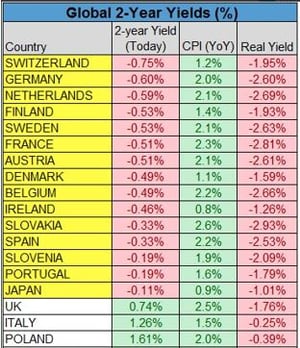 they will always say equities have value in the long term and they always go up. That is their sales tactic, what they won’t tell you is that it all depends on exactly when you start to invest. So, in order for asset prices to continue to rise, debt will have to continue to expand and all players involved will have to take on increasingly larger and larger loads. The flipside of all this is that interest rates can never rise, at least without destroying asset prices. You cut off the debt, you cut off the Ponzi and all the cards fall, period! The FED knows it and so does every other Central Bank in the world. This chart of global 2-year yields from Pension Partners Charlie Bilello, should drive home this reality:
By the way, when you pay a central bank money to hold your money, well it no longer becomes a zero-sum game then does it. You are paying them money to take risk and even if they lose, it wasn’t theirs to begin with, but hey, keep paying them to hold capital, under the guise of safety. I would rather stock pile gold bars or melt them all into one gigantic boulder, knowing full well, you would need a crane to steal it!
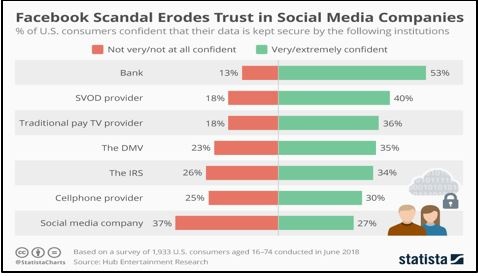
Before we get to the technical market charts, we laughed when we saw Statista’s new chart. Social Media’s trust level among consumers is now lower than the IRS, that is truly a new benchmark for futility:
Ok, on to the technical side of things where the equity markets have hit euphoric levels once again as the longest bull market ever forges ahead. The NASDAQ futures trade up near 7600, the SP500 future is above 2900 and the DOW is above 26k. Something that has been pointed out by my great associate David Wienke of Cabrera Capital is that the emerging markets in comparison to the SPY have reached lows not seen since 2004, check out his chart today of the EEM vs SPY:
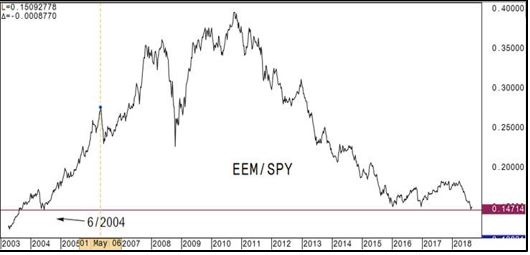
There isn’t a shadow of a doubt this is purely interest rate and US dollar outperformance related. However, we love analysis like this that shows outright indexes vs a global counterpart in terms of relative value. We feel that a few notable names will begin to look at this from a long-term valuation perspective, just sayin.
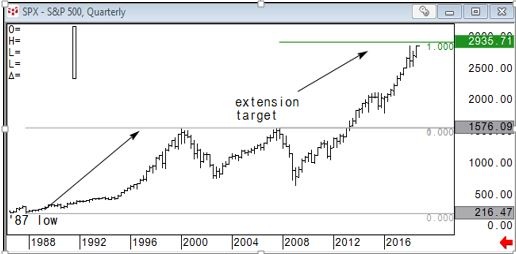
The SPX is running into the 1x extension which historically should present at least somewhat of a pause in our opinion:
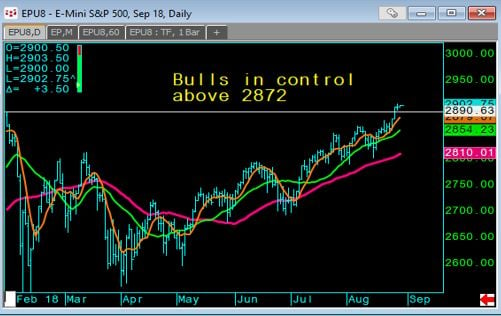
The SP500 future shows the bulls still in control above 2872:
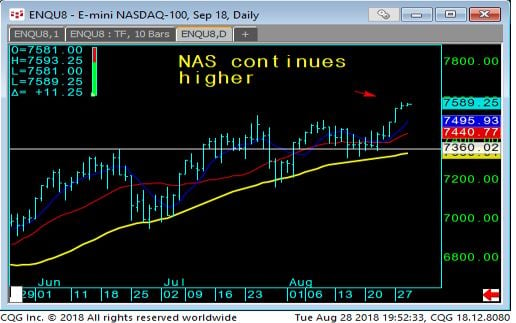
The NASDAQ future continues to press on:
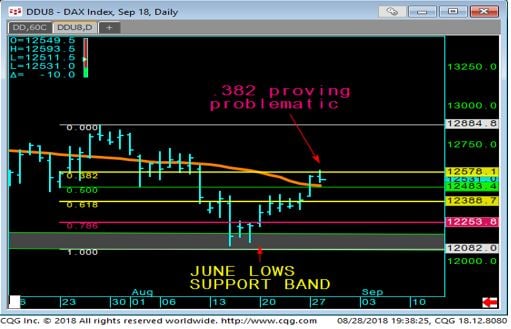
The DAX has taken a pause at the technical 38.2 retracement level
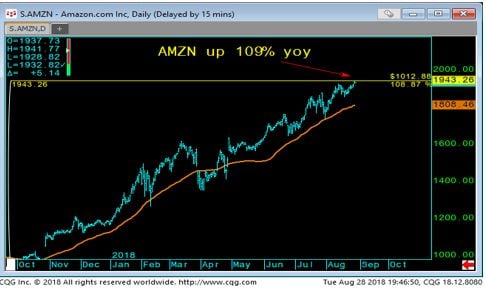
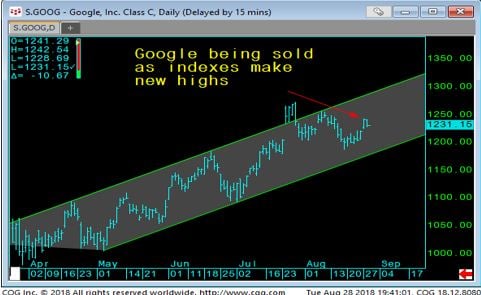
Looking at Amazon and Google we can see that Amazon is up 109% yoy and Google has retreated despite the indexes reaching new highs, which is very curious:
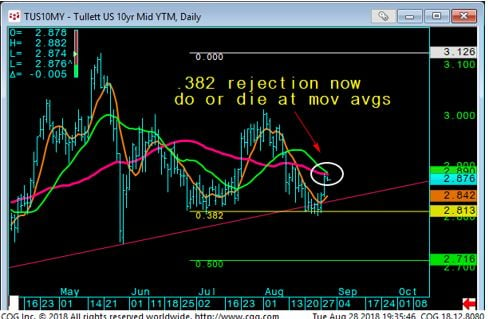
Despite reaffirmation of the FED to continue their path to normalization while at the Jackson Hole Symposium, we can see the US 10yr yields haven’t budged very much. We feel that the long end of the US treasury curve will be continually supported given the fragility of the global economic backdrop. We all know the FED can manipulate short rates higher or lower, but the long end is subject to long term analysis as to where rates will be over a longer time frame. Thus, we feel pension and insurers, SWF and large liability matchers will continue to be supportive of US rates at current levels:
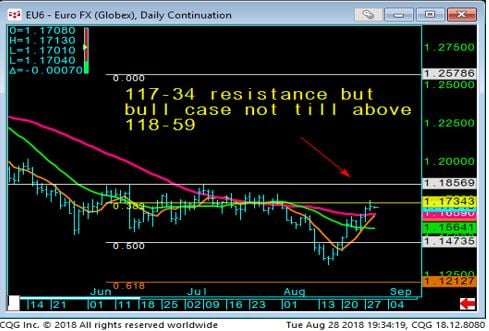
The European currency has rallied quite a bit off its recent lows, in fact some 3.2% in under 2 weeks from a low of 113-27 to just over 117 today:
Finally, we would like you to see today’s chart from Bespokepremium. It highlights the clear fact that global monetary flows have found their way right into the US equities market at the expense of mainly China since the US election of 2016. So much for all those Sharpe Ratio following, HFT and AI programmatic developers, seems like risk is much more concentrated, not more widely dispersed:
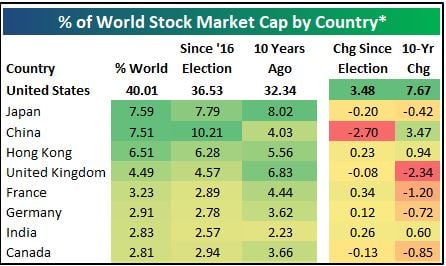
This is why it’s so important to look at investing from a global macro perspective, why we stress monitoring monetary flows and why looking at markets from various sources and interpretations are keys to successfully navigating these turbulent waters.
Despite not talking about the crypto currency markets or Bitcoin in general lately, we still believe in blockchain and will continue to report any significant changes in that space. As for now the SEC seems hell bent on rejecting any Crypto related ETF, but we expect them to acquiesce in the coming years. If they do, expect Wall Street to push very hard and expect Bitcoin and some major Alt coins to be the direct beneficiaries. As for now, Bitcoin is stable around $7000 with a market cap of around $122 billion. Bitcoin was up 2% last week but still down 53% on the year, but on this date last year, Bitcoin was $4400 so yoy it’s still up some 60%
Thanks for reading and we hope you got something useful out of this, our Chicago Bears look healthy and ready to go, the Cubs are once again showing they can put out a decent win streak and even our White Sox show some signs of promise. We are glad to see the Fall season upon us, the year is flying by, we look forward to continuing this exciting journey with you, cheers!
Capital Trading Group, LLLP ("CTG") is an investment firm that believes safety and trust are the two most sought after attributes among investors and money managers alike. For over 30 years we have built our business and reputation in efforts to mitigate risk through diversification. We forge long-term relationships with both investors and money managers otherwise known as Commodity Trading Advisors (CTAs).
We are a firm with an important distinction: It is our belief that building strong relationships require more than offering a well-rounded set of investment vehicles; a first-hand understanding of the instruments and the organization behind those instruments is needed as well.
Futures trading is speculative and involves the potential loss of investment. Past results are not necessarily indicative of future results. Futures trading is not suitable for all investors.
Nell Sloane, Capital Trading Group, LLLP is not affiliated with nor do they endorse, sponsor, or recommend any product or service advertised herein, unless otherwise specifically noted.
This newsletter is published by Capital Trading Group, LLLP and Nell Sloane is the editor of this publication. The information contained herein was taken from financial information sources deemed to be reliable and accurate at the time it was published, but changes in the marketplace may cause this information to become out dated and obsolete. It should be noted that Capital Trading Group, LLLP nor Nell Sloane has verified the completeness of the information contained herein. Statements of opinion and recommendations, will be introduced as such, and generally reflect the judgment and opinions of Nell Sloane, these opinions may change at any time without written notice, and Capital Trading Group, LLLP assumes no duty or responsibility to update you regarding any changes. Market opinions contained herein are intended as general observations and are not intended as specific investment advice. Any references to products offered by Capital Trading Group, LLLP are not a solicitation for any investment. Readers are urged to contact your account representative for more information about the unique risks associated with futures trading and we encourage you to review all disclosures before making any decision to invest. This electronic newsletter does not constitute an offer of sales of any securities. Nell Sloane, Capital Trading Group, LLLP and their officers, directors, and/or employees may or may not have investments in markets or programs mentioned herein.