March 29, 2021
By: Andrew Hecht
Overview:
- Gold has backed off since the August 2020 high
- The bullish trend in gold remains intact
- Falling bonds have weighed on the yellow metal
- When the market gets bearish, it's time to get bullish on the precious metal
At the turn of this century, gold was trading below $300 per ounce. The yellow metal traded to a low just above $250 in 1999 and 2011 as the Bank of England liquidated half the United Kingdom’s holdings. London is the hub of the international gold market. While the UK auctioned off their national treasure, other central banks and governments did not follow. Moreover, they have been net buyers of the precious metal over the past two decades, increasing their holdings.
In 2019 and 2020, the gold price rose to all-time highs in virtually all currencies. The final shoe to drop was the rally to $2063 per ounce on the nearby COMEX futures contract in August 2020.
Gold has backed off since the August 2020 high
An almost perfect bullish storm propelled gold higher in 2019 and 2020.
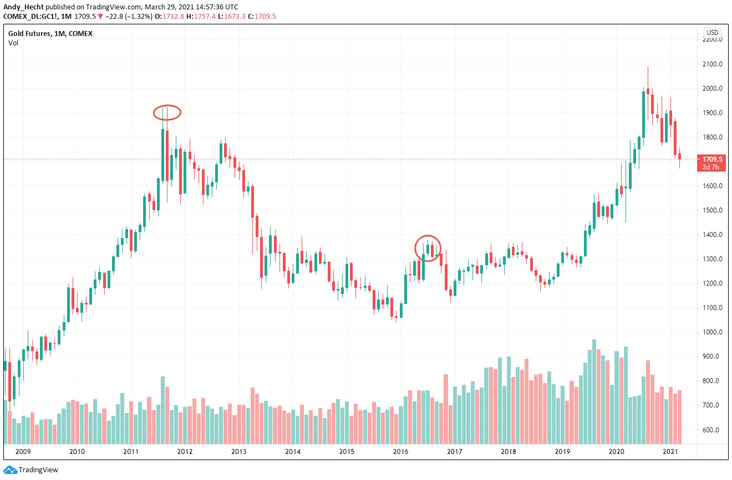
Source: TradingView
The chart highlights gold broke out above its July 2016 $1377.50 high in June 2019. The move above critical technical resistance propelled gold higher. After a risk-off inspired dip to $1450.90 in March 2020, gold climbed to a record high. As the US Federal Reserve slashed short-term interest rates to zero percent and reinstituted quantitative easing, gold posted steady gains. Moreover, a falling dollar index pushed the precious metal to a high of $2063 in August, a new record peak.
Since then, gold has corrected, and was at the $1730 level at the end of last week, over 16% below the high.
The bullish trend in gold remains intact
Even the most aggressive bull markets rarely move in straight lines. On the monthly chart, the first technical support level stands at the March 2020 $1450.90 low. The midpoint of the move from the March 2020 low to the August 2020 peak stands just under the $1757 level. Gold remains not far below that level, which is now short-term technical resistance.
Meanwhile, the bullish trend that began in the early 2000s remains firmly intact.
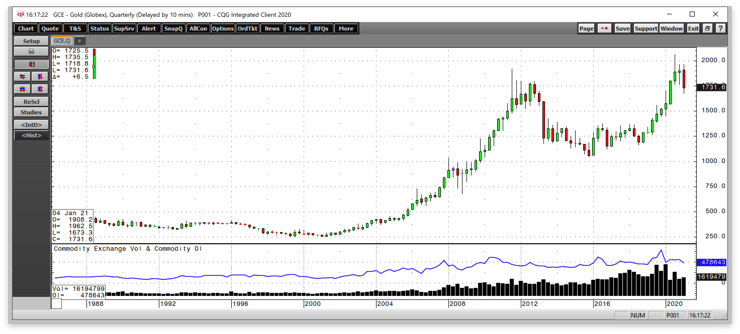
Source: CQG
The quarterly chart illustrates despite gold’s correction; the long-term picture reflects higher lows and higher highs. Gold rallied for nine consecutive quarters from 2018 through 2020. While it will likely post a loss in the first quarter of 2021, the trend remains higher.
Meanwhile, the total number of open long and short positions in the COMEX futures market declined from a record high of nearly 800,000 contracts in late 2019 when gold was on its way to the record level after a volatile first half of 2020, to below the 480,000 level at the end of last week. Open interest declined as gold corrected. In a futures market, falling open interest and decreasing price is not typically a technical validation of a bearish trend.
The shine may be off gold since last August, but the bull remains in the market.
Falling bonds have weighed on the yellow metal
Gold’s decline has correlated perfectly with the rise in long-term interest rates. About the time gold reached its peak, the US 30-Year Treasury bond futures peaked at 183-06.
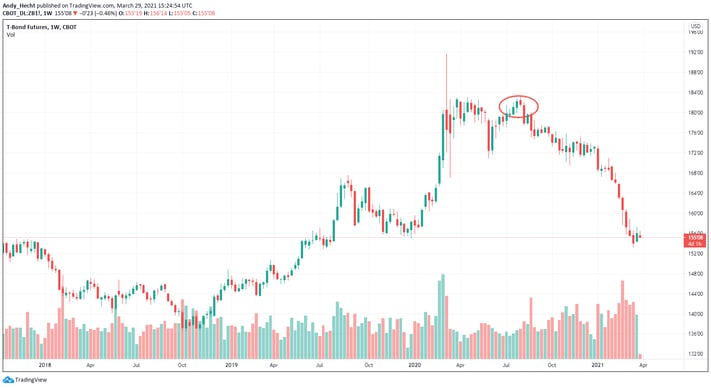 Source: TradingView
The weekly chart shows the steady drop in the long bond to the 154-29 level last week. Rising interest rates increased the cost of carrying gold and tend to be a bearish factor. The correlation since August has been almost perfect.
Meanwhile, the bonds have been falling as inflationary pressures have mounted because of monetary and fiscal stimulus. Gold is historically an excellent barometer of the economic condition. Many other commodity prices have moved to multi-year highs since gold peaked and corrected. Copper is over $4 per pound, crude oil has risen to over $60 per barrel, and grains are at over six-year highs. Gold may be down, but it is certainly not out in the current environment. We may look back at the corrective period from August to the end of March as a golden opportunity for the yellow metal.
Levels to watch
Short-term technical support on the April gold futures contract stands at the March 8 $1673.30 low. Below there, the $1668.60 bottom from June 2020 is the next critical level. Long term support levels are at $1450.90, the March 2020 low, and $1377.50, the breakout level high from July 2016.
Technical resistance on April futures is at $1754.20. As April is rolling to June, the level on the June futures is at the $1756 level. Above there, the next targets are north of $1800 per ounce.
When the market gets bearish, it’s time to get bullish on the precious metal
Over the past two decades, the best time to buy gold has been when it has fallen out of favor with most market participants. Perhaps the starkest example was way back in 1999-2001. The Bank of England decided to sell half the UK’s reserves and create what turned out to be a bottom.
We are hearing a lot about digital currencies these days as everyone loves a bull market. Bitcoin and other cryptocurrencies have experienced parabolic moves, stealing gold’s thunder. However, the current economic landscape continues to favor the yellow metal. Corrections and consolidation periods in bull markets are healthy as they build cause for higher highs. The best time to consider adding gold to your portfolio or increasing holdings has been on price weakness over the past two decades.
Nothing is wrong with gold- It is resting and building cause for future rallies.

Trading advice given in this communication, if any, is based on information taken from trades and statistical services and other sources that we believe are reliable. The author does not guarantee that such information is accurate or complete and it should not be relied upon as such. Trading advice reflects the author’s good faith judgment at a specific time and is subject to change without notice. There is no guarantee that the advice the author provides will result in profitable trades. There is risk of loss in all futures and options trading. Any investment involves substantial risks, including, but not limited to, pricing volatility, inadequate liquidity, and the potential complete loss of principal. This article does not in any way constitute an offer or solicitation of an offer to buy or sell any investment, security, or commodity discussed herein, or any security in any jurisdiction in which such an offer would be unlawful under the securities laws of such jurisdiction.