January 14, 2018
So let’s get to it, what did we learn over the past week? We were informed by Intel that its computer chips were affected by a bug that makes them vulnerable to hacking. All computers with Intel chips from the past 10 years are affected. Considering that computer chips are basically the backbone and brain behind everything electronic including the entirety of the internet itself, this should be very alarming news. We can’t say that we are surprised, we have said in many past writings that the internet itself will have to adapt to these internal threats. Not to mention the internet security threats that future quantum computing presents. To say that this news out of Intel is alarming, is quite an understatement and it’s why the future of technology will need to be completely and openly discussed by all major stakeholders. This will take a collaborative effort, one by which profits will need to be set aside for the greater good. Whether or not this can be achieved is another thing, but the viability of the internet, the Internet of Things and Artificial Intelligence comes completely into question now. Intel’s stock price barely fell 5% and why should it, if these things need to be replaced, that means more sales and of course no rebates.
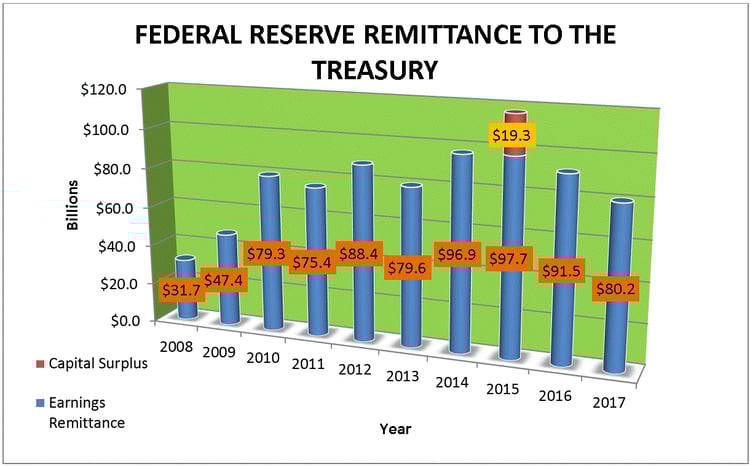
Also out this week the AP reported that the FED projects $80.2 billion in remittance back to the Treasury Dept. Here is a chart of the last decade in remittance. As you can see the FED has paid back billions to its enabler, is it safe to say this is like a drug kingpin and his pushers…maybe that’s too harsh…Anyway the charts show 3 years in a row of declining remittance and one thinks we can just continue to raise rates, can you imagine this levered behemoth and its Dv01 crushing leverage if equities turn and interest rates rise?
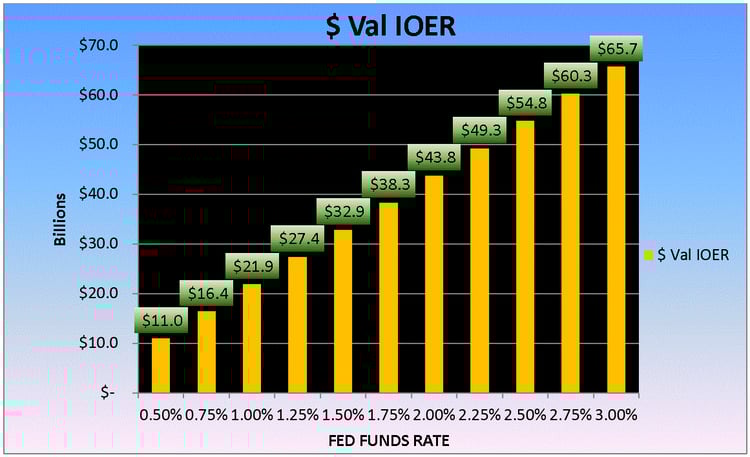
To further solidify the connection between central banks, the Fed Funds rate and Federal Reserve remittance, let’s not forget Interest on Excess Reserves (IOER) shall we. As you can see from our chart below the higher the Fed Funds rate the larger the subsidy to the banking sector both foreign and domestic. So if the FED raises the Fed Funds cap to 2.25% this year than the subsidy to the banks will reach nearly $50 Billion! Is it just us or do all the dots connect to a gigantic stealth bailout that continues and has never gone away?
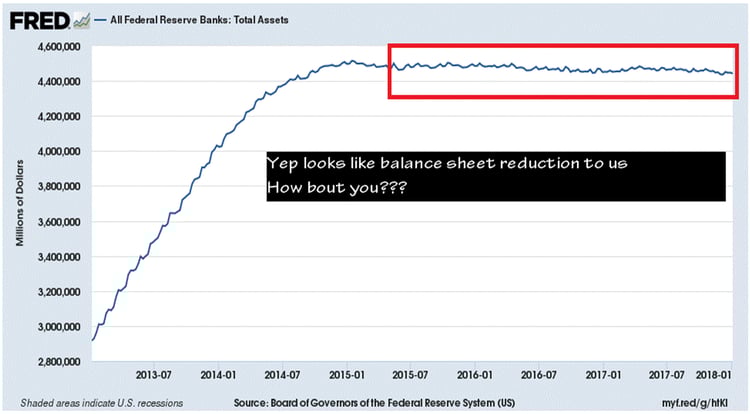
What about that alleged balance sheet reduction? As you can see from this chart the balance sheet seems pretty steady to us, what do you see?
This all looks great as the QE and non-balance sheet roll down continues, but what happens if things change? What happens as interest rates rise and remittance continues to shrink? What is also strange is the fact that the US Gov’t continues to reap the billions in payments from Fannie and Freddie. This is purely a testament to their wide over reach into the private sector by which they seemingly confiscate privatized earnings and use them for their own purpose as opposed to allowing the public to benefit.
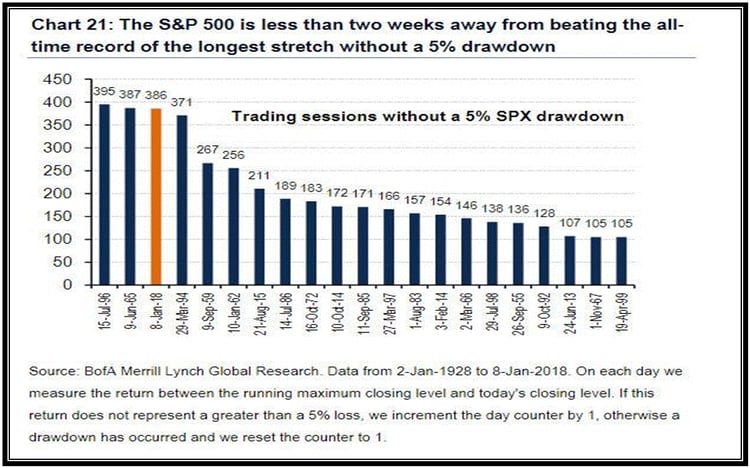
Speaking of central banks, the Swiss National Bank made $55 billion last year. This is the byproduct of counterfeiting by printing their currency, sending it out and receiving foreign currency to then buy foreign equities, in particular the likes of Apple Inc. and Microsoft Corp. We believe they will reach $100 Billion in US equity holdings this year and a balance sheet that will near $1 Trillion in assets. Get it while you can and when one wonders why the markets never fall, well its rinse recycle repeat…and oh yeah BTFD. Speaking of not falling here is a chart of the lack of 5% drawdowns in the SP500 which as of this writing we just took over the coveted #2 spot and a week or so we will be #1 no doubt:
We heard from two big bond titans this week, or double G we like to now call them, Bill Gross and Jeff Gundlach, who presented us with his monthly presentation. Gross called into question the US Bond market as the US 10yr yield chart seems to be gearing up for a breakout
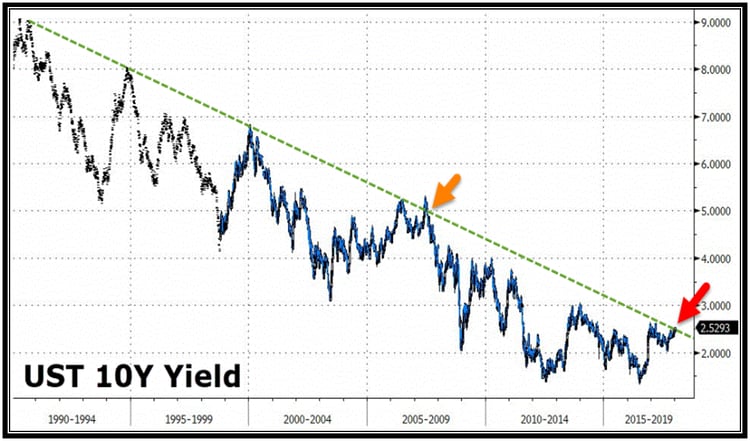
Gross posits that the trend has been broken and we do agree that the US 10yr has broken it, but we view 2.67% the real line in the sand and we would rather err with caution as we have seen this time and time again as every 5 year period since 1980 has started with higher yields than where they ended. Now, 2015 the 10yr rate started around 2.17% and by 2020 will it be higher or lower is anyone’s guess. The way the equity markets are going, a one mere way train to tinsel town, the 10yr rate will most likely be higher. However, and a big however, is if there is even one sniff of a banking crisis, a geo political crisis and considering the size of these overleveraged balance sheets, a sub 2% 10yr rate is certainly not out of the question. Mr. Gundlach has openly stated he sees a negative return on the equity complex this year, a bold call indeed and perhaps a bit of the reason he thinks Gross is a bit early on his bearish bond call. He sites that a 30yr rate above 3% would most likely be his signal. It is important to note that Mr. Gundlach believes 10yr rates can reach 3.25% this year and 6% by 2021. Really, does he honestly believe that or is he talking his book, because some of this doesn’t jive. He is calling for both bonds and equities to fall? That is interesting and thus if they both fall where will the money go? Crypto perhaps, he did say the high for Bitcoin was in…another call we don’t agree with, but what do we know.
Also out this week were rumors of the PBOC selling US treasuries? We can’t help but think these rumors come with zero credibility, nor do we think the PBOC alone will have the power to move yields significantly. Not to mention they added nearly $180 Billion in US Treasury holdings in 2016 alone. They peg their currency as well so, do pray tell how can one accomplish such a peg and yet sell off foreign bond and currency holdings? Not to mention the Japanese, the ECB and a whole host of private buyers would gladly take them off their hands, so when we hear these things we do take it with a grain of rice.
We have also been hearing about the Buffet indicator and its frothy levels. We have the chart here:
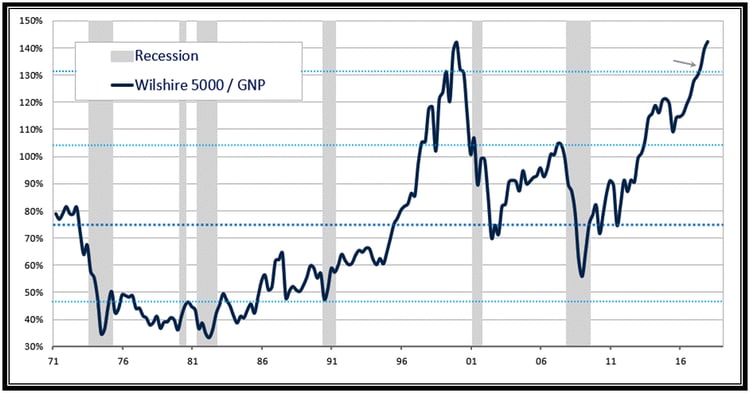
The only thing we can take from this chart is that with over 4x global central bank balance sheet expansion over the last 9 years, we can barely muster enough market cap based percentage gains to equal that of the internet bubble high metric in 2000. Something is strange about that don’t you think? We create all this new global debt and yet here in the US, this metric can barely reach prior peak levels. For us this is a bit ominous or the flip side is in terms of anomalies and performance we might be in for a huge speculative blow off. We aren’t sure which can occur, will this fall back down to 80% levels or surpass 140% by factors? We suppose both are equally possible and considering the free monetary central bank spigot remains open, we feel this Buffet indicator is either overdone or we are going to fly past that 140% marker and make a new high…but we weight both scenarios as equally plausible.
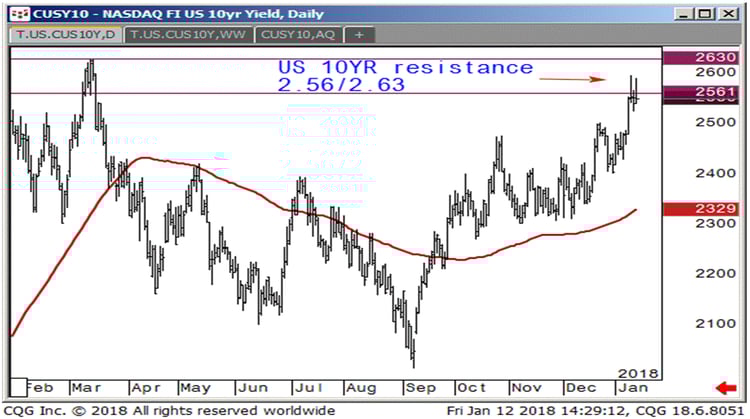
Now we move to the markets and a few technical charts. The US 10yr yield chart has tested short term resistance bands of 2.56/2.63% with major pivot at 2.67% nearby. We feel that the market has paused here to gain better insight from the FED as to their wherewithal to continue rate hikes and as we said before 2.67% is major and will likely be tested and rejected to usher in a new roll down in rates, or it will mark the end of an era.
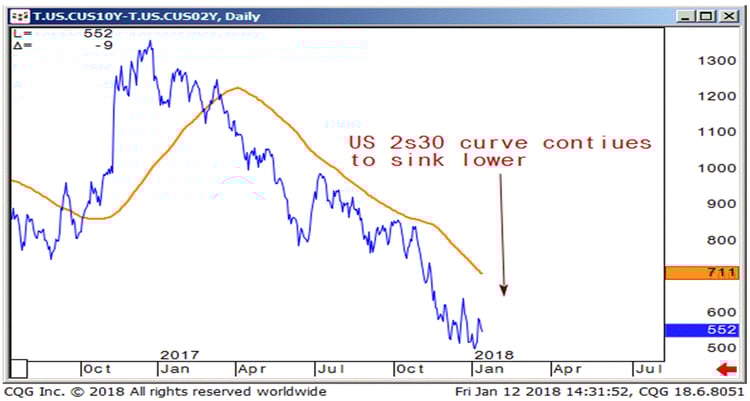
When we look at the US 2s30 yield curve chart we continue to see it flattening out, this isn’t a trend we suggest fading as it seems to be firmly entrenched as every bounce is being sold into, fundamentally with a hiking FED makes sense to us:
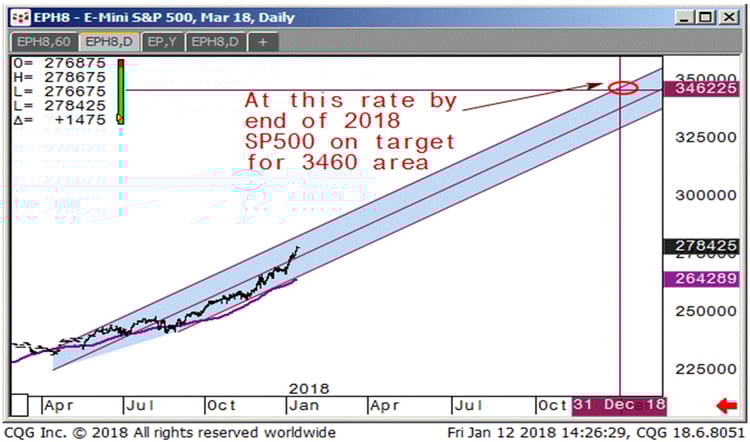
Moving over to the Equity Index Futures we have decided to draw an extension trend channel for the SP500. Considering the veracity of last year’s move and going with the trend ex any exogenous shocks, the SP500 despite Mr. Gundlachs call, we feel has the potential to reach 3400 or a return of 27%. That is our high end estimate and is entirely dependent upon the continued central bank expansion and a less than hawkish Fed. We view this call as dependent upon a continued linear climb with Vwap support underneath at the mid 2650 area. We must not that nothing moves in a straight line but merely show this as an example of possibility based on current trajectories:
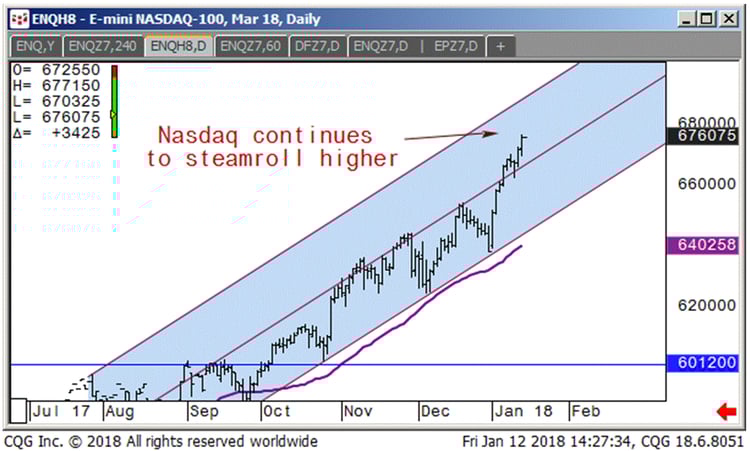
As for the NASDAQ Future, it continues to climb toward 7000:
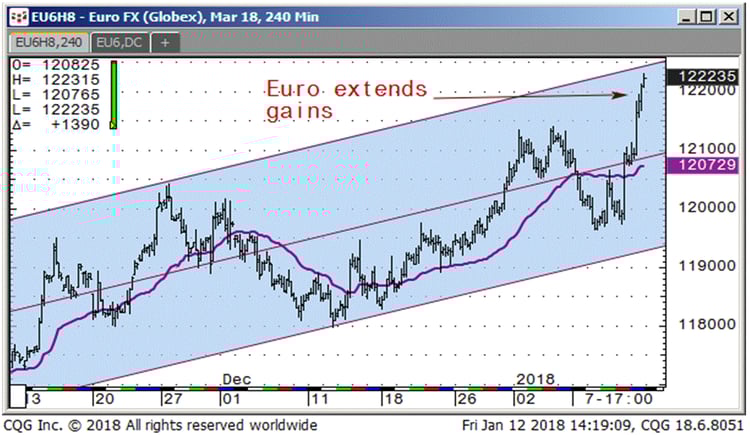
Moving to the currency futures, both the Euro and the Yen have seen some nice up moves this week, the Euro is nearing trend channel resistance near 122-50:
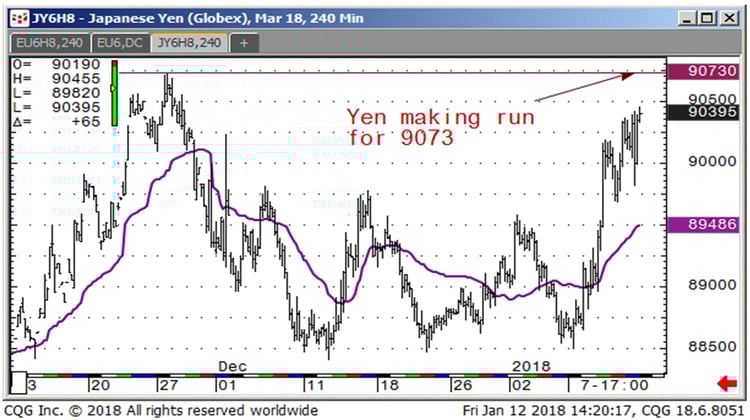
The Yen is also nearing prior highs at 9073:
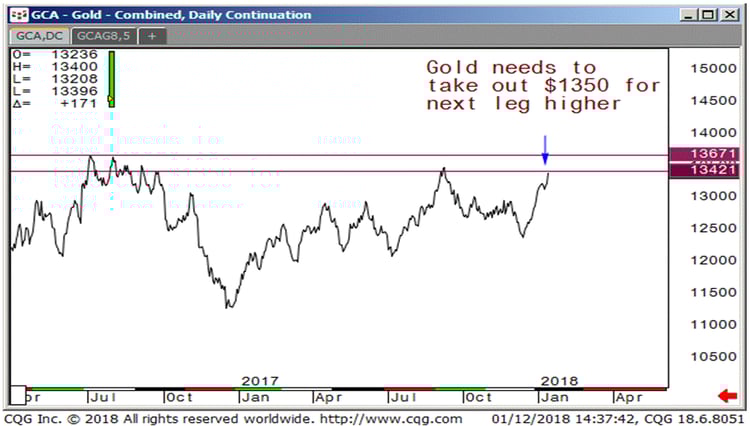
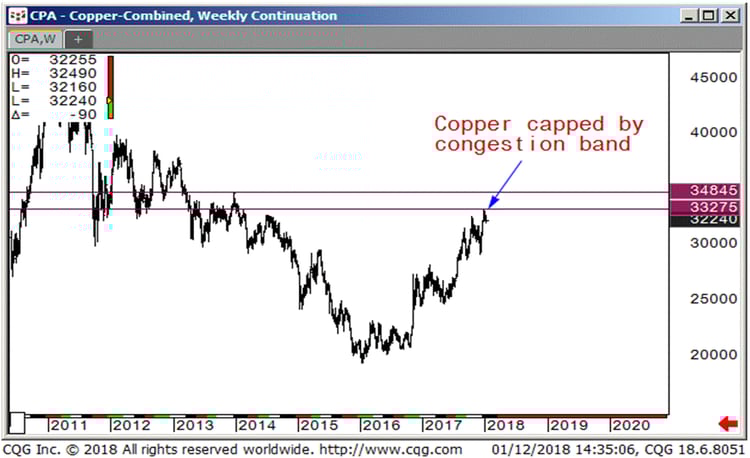
Moving to the metals, Copper and Gold have both had some nice runs as well, Gold needs to trade above $1350 for things to get really interesting and Copper has had a nice 2 year run and is currently hovering near resistance bands 332/348, a suspected break of those levels may propel a fresh up move to prior highs:
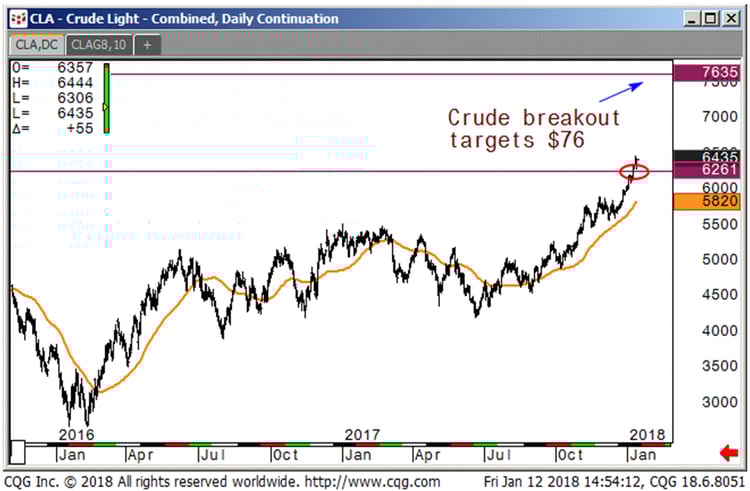
The Crude Oil Future continues its bull run which started last June. With it trading above $62 we feel that the bull case may continue and peg the $76 level as a clear target above. We can’t help but think the events out of Saudi Arabia, the end of the petrodollar arrangement, the new Yuan based oil futures are having some initial effects. We may even begin to hear talks of a weakening US dollar as rationale for the continued move higher. Are commodity trend following CTAs adding to positions here? We would like to hear from any participants in the space. Seems like speculative net positions continue to hold steady to a bit higher as prices rise, so that would indicate to us that players are not selling into these higher prices, but potentially adding to them, but it doesn’t seem that significant:
That’s it for the technical and market commentary. We look forward to bringing you more insight into these and other markets this year. We will now turn it over to the segment we know as:

CryptoCorner
Eastman Kodak joined the blockchain foray this week by announcing a partnership with WENN digital to license an image rights management platform, which will utilize the token “Kodakcoin” We can’t argue with the logic considering not only that Crypto is a rage for any equity that wants a quick pop, but in reality there is entirely too much free content out there floating around and if Kodak does succeed in tagging photos and those whose rights it is if their image is used somewhere, should benefit. We agree with the logic, however the implementation of such is a huge undertaking. Will this disrupt Facebook, Instagram, Snapchat etc…who knows, but we like the thinking behind it and so did its shareholders as the stock popped from $3 obscurity to over $13, settling back in today at $9.20.
We read a great piece this week by Preethi Kasireddy a blockchain engineer, entitled “Fundamental challenges with public blockchains.” She spoke of the fundamental positive potential as well as the technical barriers of blockchain technology. Some of the constraints she so succinctly outlined were:
- Limited scalability
- Storage constraints
- Lack of governance and standards
She outlined many more but one item of note that she touched on was the threat from quantum computing. As our readers know, we have also talked about this at some length, she said, “The scary truth is that most popular public-key algorithms can be efficiently broken by a sufficiently large quantum computer.” We recognize the importance that more research, awareness and collaboration on this subject are an important precursor to the viability of the digital future. We highly recommend reading it in its entirety and it can be found Here
- Top bitcoin address sits at 179203 BTC for the 2nd consecutive week with a value of $2.5 billion
- Next two addresses hold 144369 & 110516 BTC respectively with values of $2 and $1.5 billion
- # of Bitcoin addresses continues to grow with another 2.6 million added
- Jaime Dimon “regrets” calling Bitcoin a fraud –go figure
- South Korea flip flopping on decision to outlaw trading in all crypto currencies –seems a bit rash to us and without any real discussion amongst stakeholders
- Word on the street KFC Canada plans to offer a promotional “Bitcoin Bucket” of chicken –two drums up for us!
- US treasury sect. Mnuchin says “very focused on cryptocurrencies” says Fed is unlikely to develop its own digital currency (isn’t the US$ already digital?)
- Arizona Senator Petersen submitted a bill to allow citizens to pay taxes in Bitcoin
- Ethereum up big over the last week trading above $1200
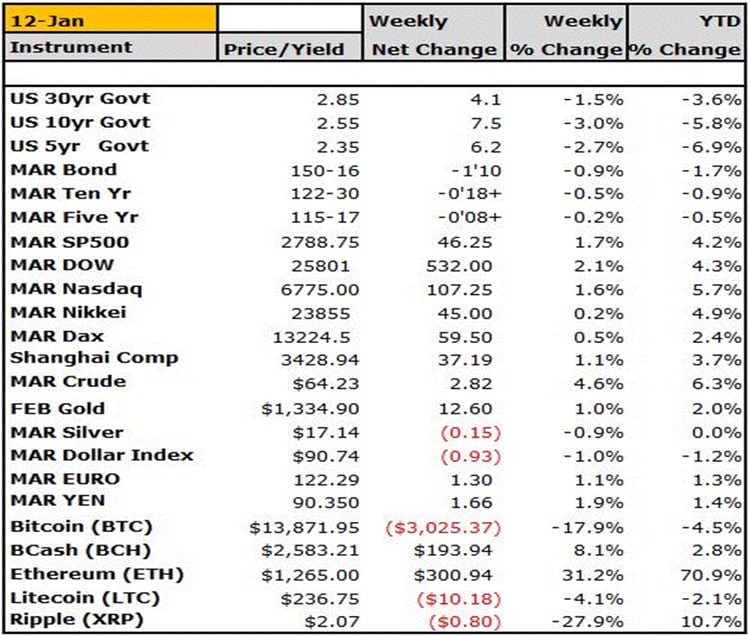
- Ripple and Litecoin holding steady near $2 and $230 respectively
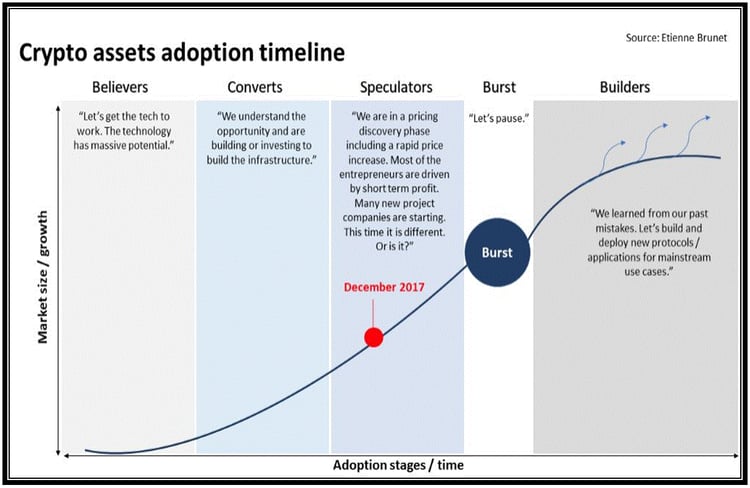
Ok that is it, we have been reading a lot about the progress in the blockchain space, however as it’s just in its infancy, we expect a long adjustment period as businesses and consumers figure out where the utility function is. This reminds us of a chart we saw this week shown here entitled Crypto assets adoption timeline:
Finally, we will decidedly end our notes with our reaffirmation of the growing need for alternative strategies. We would like to think that our alternative view on markets is consistent with our preference for alternative risk and alpha driven strategies. Alternatives offer the investor a unique opportunity at non correlated returns and overall risk diversification. We believe combining traditional strategies with an alternative solution gives an investor a well-rounded approach to managing their long term portfolio. With the growing concentration of risk involved in passive index funds, with newly created artificial intelligence led investing and overall market illiquidity in times of market stress, alternatives can offset some of these risks.
It is our goal to keep you abreast of all the growing market risks as well as keep you aligned with potential alternative strategies to combat such risks. We hope you stay the course with us, ask more questions and become accustomed to looking at the markets from the same scope we do. Feel free to point out any inconsistencies, any questions that relate to the topics we talk about or even suggest certain markets that you may want more color upon.
___________________________________________________________________________________
Capital Trading Group, LLLP ("CTG") is an investment firm that believes safety and trust are the two most sought after attributes among investors and money managers alike. For over 30 years we have built our business and reputation in efforts to mitigate risk through diversification. We forge long-term relationships with both investors and money managers otherwise known as Commodity Trading Advisors (CTAs).
We are a firm with an important distinction: It is our belief that building strong relationships require more than offering a well-rounded set of investment vehicles; a first-hand understanding of the instruments and the organization behind those instruments is needed as well.
Futures trading is speculative and involves the potential loss of investment. Past results are not necessarily indicative of future results. Futures trading is not suitable for all investors.
Nell Sloane, Capital Trading Group, LLLP is not affiliated with nor do they endorse, sponsor, or recommend any product or service advertised herein, unless otherwise specifically noted.